Testing Your Cloud's Power Efficiency
Jan 12, 2026

In most cloud environments, customers don't have to think about how much power their data centers use. Still, in some regions, organizations are responsible for reporting carbon emissions tied to their cloud workloads. Since the power usage of an Amazon Elastic Compute Cloud (EC2) instance directly affects its environmental footprint, improving efficiency helps both your organization and the planet. It isn’t just a theoretical concern: in cities like Dublin and Frankfurt, new data centers are facing delays of up to three years just to connect to the power grid due to capacity limits.
Here’s the good news: our testing shows that AMD-powered Amazon EC2 instances are not only more power-efficient but also deliver 2.7x better performance per watt compared to Intel-based instances. By consuming 213 fewer watts on average, AMD instances offer a clear advantage for organizations looking to reduce their environmental impact and optimize costs.
Let’s dive into how we conducted these tests, the tools we used, and how you can measure the power consumption of AMD-powered Amazon EC2 instances using bare-metal configurations.
How We Tested Power Consumption
To measure the hardware power usage of your instances accurately, you’ll need to use a bare-metal Amazon EC2 instance. That’s because the model-specific register (MSR) data required for power readings is only available on bare metal. With bare-metal instances, your operating system talks directly to the physical CPU with no hypervisor in the way. On standard EC2 instances, the hypervisor blocks MSR access, and even if it didn’t, CPU scheduling would make the results unreliable.
It’s also important to note that CPUs pull their maximum power only when they’re under load. Modern processors dynamically adjust power draw, so to see true peak consumption, you must stress the CPU while collecting data.
To simplify the testing process, we automate everything from end to end. When you deploy and run the provided AWS Systems Manager (SSM) Automation document via the AWS CloudFormation template, it sets up the environment, runs the tests, sends the metrics to Amazon CloudWatch, and then cleans up all the resources afterward.
What the Automation Deploys
The SSM Automation workflow spins up the following resources:
- 1 Amazon Virtual Private Cloud (VPC)
- 1 Amazon VPC Internet Gateway (IGW), attached to the VPC
- 1 Public VPC Subnet
- 1 custom VPC route table with a 0.0.0.0/0 route through the Internet Gateway
- 1 AWS Identity and Access Management (IAM) Amazon EC2 instance role with AmazonSSMManagedInstanceCore, CloudWatchAgentServerPolicy, and a custom inline policy
- 2 Amazon EC2 Metal Instances:
- AMD-powered: m8a.metal-48xl
- Intel-powered: m8i.metal-48xl
Instance Configuration
All tests are rerun on Ubuntu Server 24.04 (/aws/service/canonical/ubuntu/server/24.04/stable/current/amd64/hvm/ebs-gp3/ami-id). We initially tried Amazon Linux 2 but had issues retrieving power data. You may have different results depending on your Linux distribution.
These instances use their default settings, with only a few required additions.
The Tools to Install
- System tools: unzip, curl, Python 3, linux-tools-common, linux-tools-generic, msr-tools, stress-ng, AWS CLI.
- Turbostat collects CPU metrics such as frequency, idle states, temperature, and, especially, PkgWatt, which we use to measure power draw.
- Stress-ng, which applies CPU load and reports “bogus operations per second (bogos)” so we can measure consumption under maximum stress.
Deploying and Running the Test Environment
We’ve designed the testing process to be fully automated. To get started, simply download and deploy the CloudFormation template, which provisions the Power Consumption SSM Automation document. If you're new to CloudFormation, setup instructions are available in AWS documentation.
Once the SSM Automation document is deployed, you can run it manually by following the same documentation. After you invoke it, the workflow handles everything and removes all resources once the tests are complete.
One important note: Do not run these tests in a production AWS account. If you'd like to try them yourself, use a non-production or sandbox AWS environment.
What to Expect When Running the Test
The test process takes up to 30 minutes to complete. There is a 10-minute sleep timer to ensure the instances terminate before removing all other components. After a test run is complete, you can go to CloudWatch to review the results.
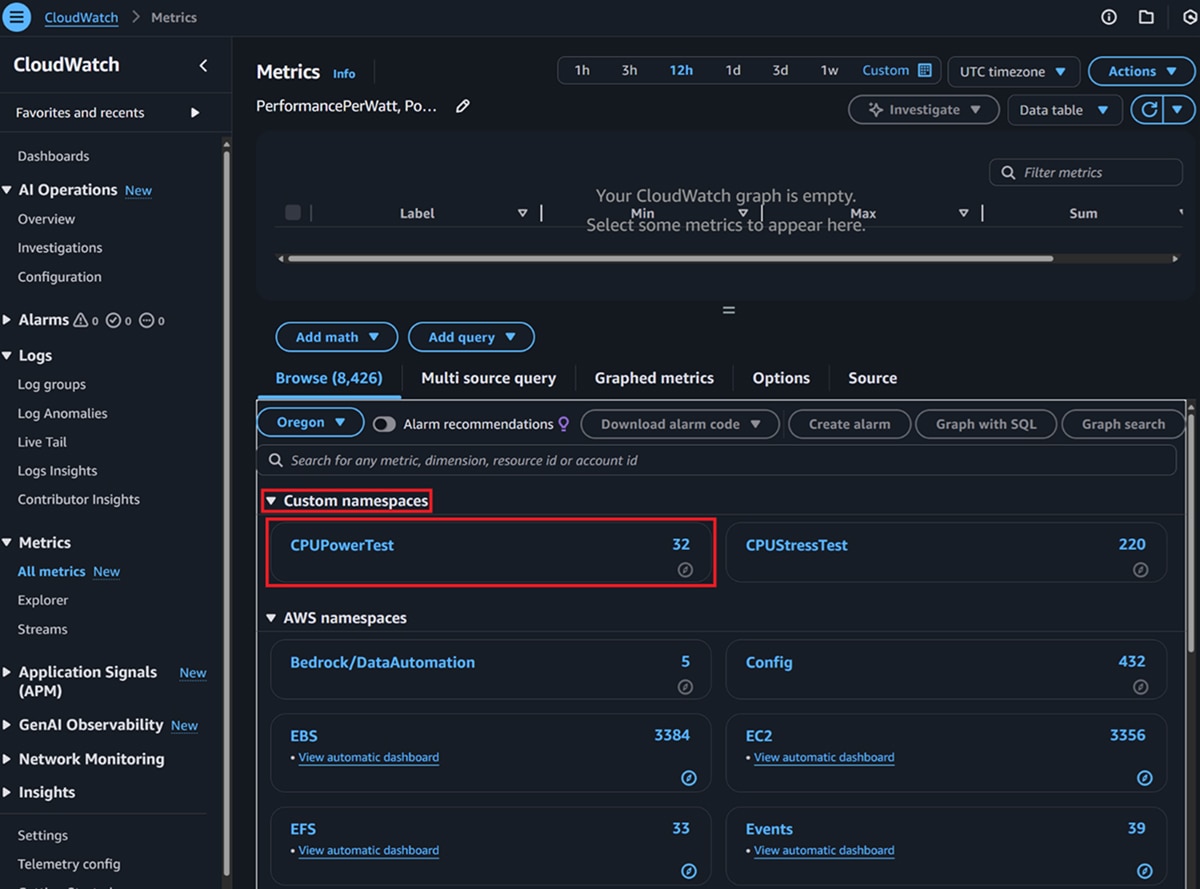
- Open the CloudWatch console.
- On the left-hand navigation pane under Metrics, select All metrics.
- In the bottom pane of the metrics console, select the Custom namespace titled CPUPowerTest.
4. Within the Custom namespace, select the dimension InstanceID.
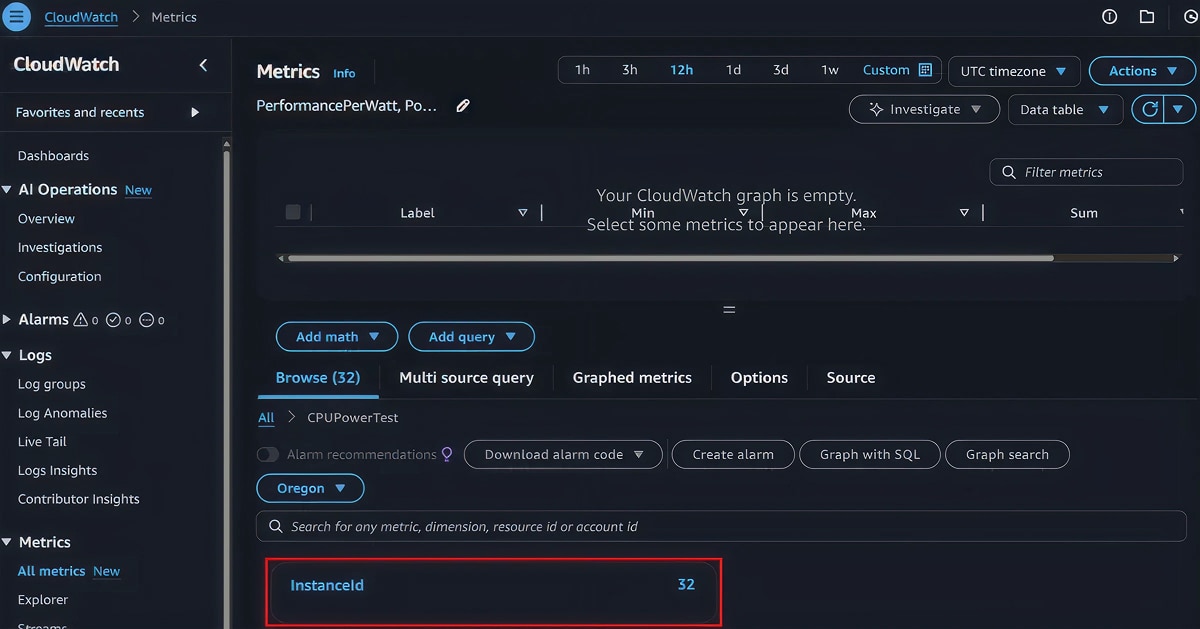
5. There you will see a list of instances that have published metrics to CloudWatch. Select the instance(s) you would like to review. If you have a large number of instances, you will need to know the InstanceID of the instances you want to review.
Note: Each instance will have two metrics: PowerConsumptionWatts (amount of wattage the CPU consumed) and PerformancePerWatt (Bogo Ops per second/wattage).
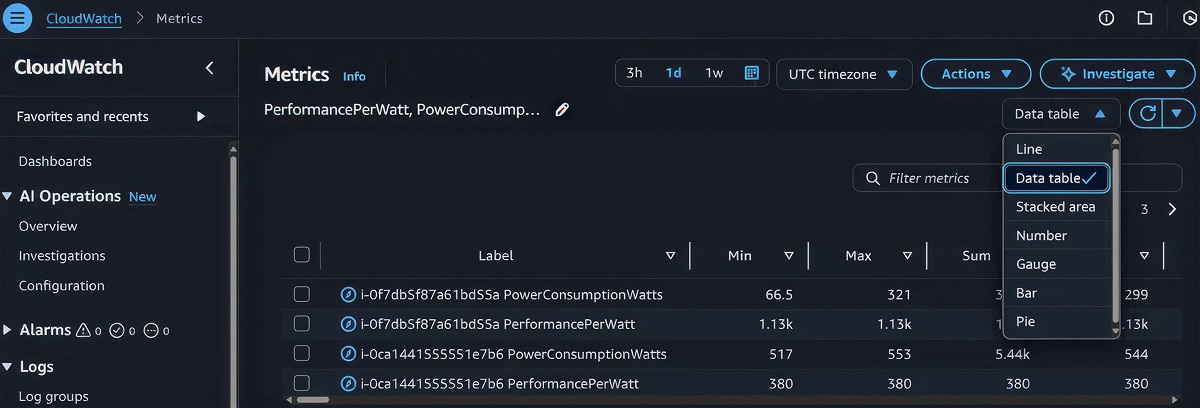
6. To make the data easier to consume, we recommend you use the "Data table" view to review the information
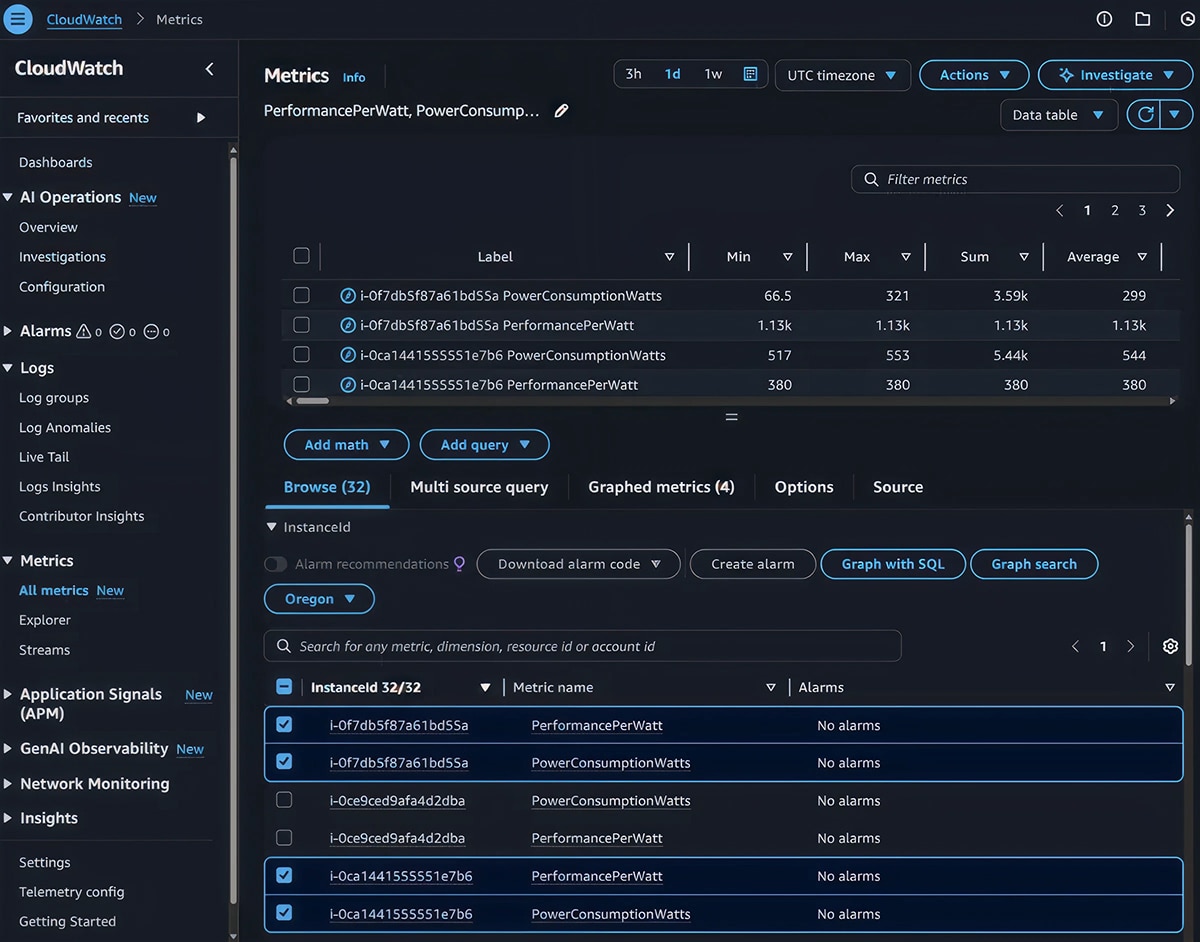
7. Now that you have the data, let's go through the data displayed.
a. Label is populated by default with the InstanceId and metric.
b. Min is the lowest CPU wattage or the lowest performance-per-watt metric reported. In this test scenario, this metric is not to be evaluated.
c. Max is the highest CPU wattage or performance-per-watt metric reported. This metric shows you the high-water mark for CPU wattage consumed or performance per watt.
d. Sum is the aggregate CPU wattage or the performance-per-watt metric reported. In this test scenario, this metric is not to be evaluated.
e. Avg is the average CPU wattage or the performance-per-watt metric reported. This metric shows you the average CPU wattage consumed or performance per watt.
8. For this test, focus on the Max and Avg metrics. Both metrics will show the maximum and average CPU consumption when it is fully utilized.
Results: AMD vs. Intel
Keep in mind, we didn’t perform optimizations or tweaks specific to AMD or Intel on the instances. The systems were configured with the bare minimum software and settings needed to perform the tests.
The following table contains the AMD results from eight runs of the SSM automation document.
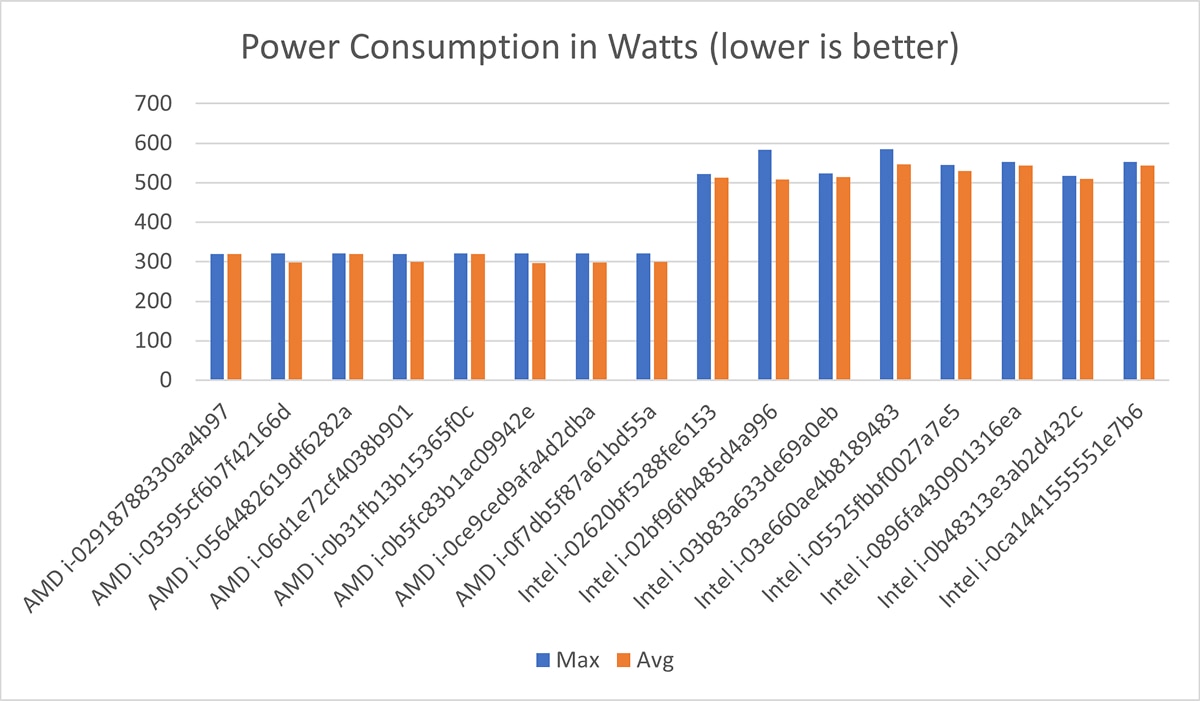
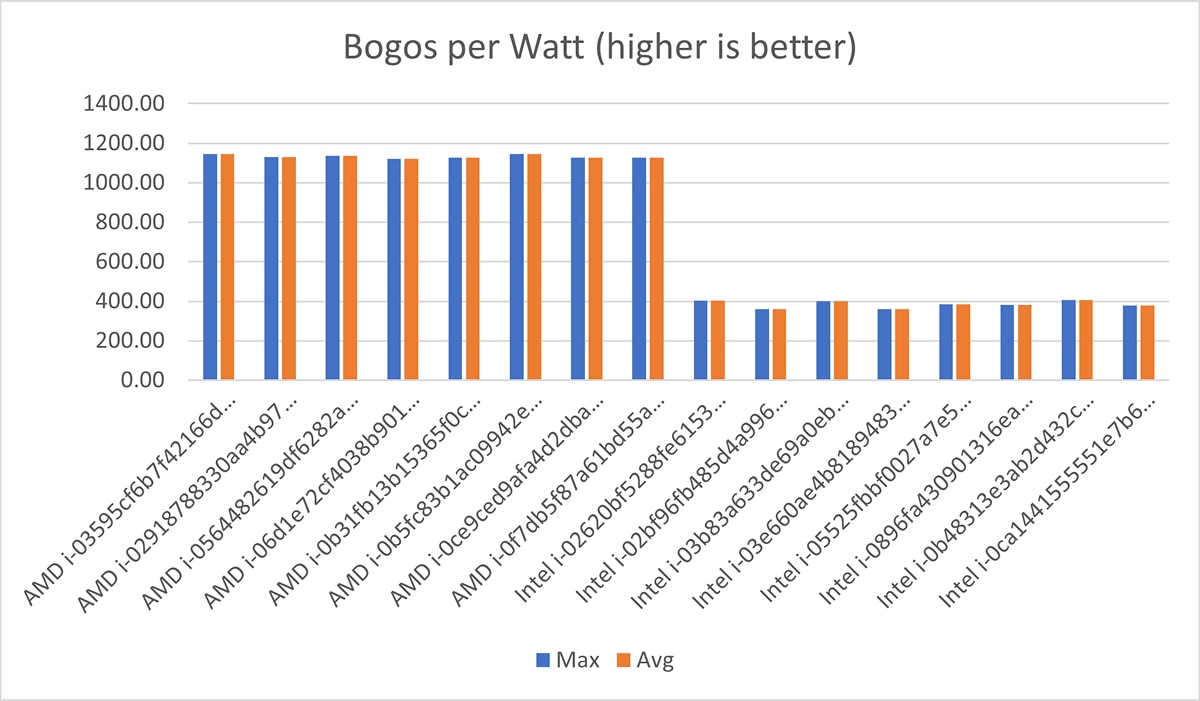
As you will see below, the highest observed CPU wattage usage for an AMD-powered m8a-metal.48xlarge Amazon EC2 instance was 321 watts, with an average utilization of ~307 watts. For the performance-per-watt metric, the lowest returned value was 1121.49 bogus operations per second per watt, with an average bogus operations per second per watt of ~1,132.
Label |
Max |
Avg |
AMD i-02918788330aa4b97 PerformancePerWatt |
1129.62 |
1129.62 |
AMD i-02918788330aa4b97 PowerConsumptionWatts |
320 |
320 |
AMD i-03595cf6b7f42166d PerformancePerWatt |
1146.27 |
1146.27 |
AMD i-03595cf6b7f42166d PowerConsumptionWatts |
321 |
298 |
AMD i-0564482619df6282a PerformancePerWatt |
1137.55 |
1137.55 |
AMD i-0564482619df6282a PowerConsumptionWatts |
321 |
320 |
AMD i-06d1e72cf4038b901 PerformancePerWatt |
1121.49 |
1121.49 |
AMD i-06d1e72cf4038b901 PowerConsumptionWatts |
320 |
299 |
AMD i-0b31fb13b15365f0c PerformancePerWatt |
1126.97 |
1126.97 |
AMD i-0b31fb13b15365f0c PowerConsumptionWatts |
321 |
320 |
AMD i-0b5fc83b1ac09942e PerformancePerWatt |
1145.37 |
1145.37 |
AMD i-0b5fc83b1ac09942e PowerConsumptionWatts |
321 |
297 |
AMD i-0ce9ced9afa4d2dba PerformancePerWatt |
1127.80 |
1127.80 |
AMD i-0ce9ced9afa4d2dba PowerConsumptionWatts |
321 |
298 |
AMD i-0f7db5f87a61bd55a PerformancePerWatt |
1126.06 |
1126.06 |
AMD i-0f7db5f87a61bd55a PowerConsumptionWatts |
321 |
299 |
The following table contains the Intel results from eight runs of the SSM automation document. As you will see below, the highest observed CPU wattage usage for an Intel-powered m8i-metal.48xlarge Amazon EC2 instance is 585 watts, with an average utilization of ~526 watts. For the performance per watt metric, the lowest returned value was 360 bogus operations per second per watt, with an average bogus operations per second per watt of ~385.
Label |
Max |
Avg |
Intel i-02620bf5288fe6153 PerformancePerWatt |
403 |
403 |
Intel i-02620bf5288fe6153 PowerConsumptionWatts |
522 |
513 |
Intel i-02bf96fb485d4a996 PerformancePerWatt |
360 |
360 |
Intel i-02bf96fb485d4a996 PowerConsumptionWatts |
583 |
509 |
Intel i-03b83a633de69a0eb PerformancePerWatt |
401 |
401 |
Intel i-03b83a633de69a0eb PowerConsumptionWatts |
524 |
515 |
Intel i-03e660ae4b8189483 PerformancePerWatt |
360 |
360 |
Intel i-03e660ae4b8189483 PowerConsumptionWatts |
585 |
547 |
Intel i-05525fbbf0027a7e5 PerformancePerWatt |
386 |
386 |
Intel i-05525fbbf0027a7e5 PowerConsumptionWatts |
545 |
529 |
Intel i-0896fa430901316ea PerformancePerWatt |
381 |
381 |
Intel i-0896fa430901316ea PowerConsumptionWatts |
553 |
544 |
Intel i-0b48313e3ab2d432c PerformancePerWatt |
407 |
407 |
Intel i-0b48313e3ab2d432c PowerConsumptionWatts |
517 |
510 |
Intel i-0ca1441555551e7b6 PerformancePerWatt |
380 |
380 |
Intel i-0ca1441555551e7b6 PowerConsumptionWatts |
553 |
544 |
The following two graphs plot all these results. The first one shows power consumption, and the second one shows performance per watt.
Conclusion: AMD has the Power Efficiency Advantage
AMD-powered Amazon EC2 instances are the most power-efficient and most powerful x86 processors on AWS. Our testing revealed that, at maximum power, AMD instances draw 196 fewer watts than their Intel counterparts and, on average, they consume 213 fewer watts. Despite using significantly less power, AMD outperforms Intel by an impressive 2.7x (or ~175%) in performance per watt.
This isn’t just about numbers. The results highlight broader implications for cloud users and the environment. For organizations in regions with strict carbon reporting or power grid constraints, AMD-powered instances provide a clear path to reducing environmental impact while maintaining high performance. Lower power consumption also translates to cost savings over time.
It’s important to note that this test wasn’t designed as a benchmark but as a practical validation of system performance under real-world conditions. The results provide insight into the power demands faced by hyperscalers like AWS and highlight the critical role efficient processors play in meeting those demands sustainably.
For businesses modernizing their cloud workloads, AMD-powered EC2 instances offer a compelling choice for cost, performance, and sustainability. With tools like the AMD EPYC™ Advisory Suite and partnerships with AWS, AMD is ready to help you find the right solution. Try the test yourself or contact us at AWS@AMD.com to learn more.
Don’t Go It Alone
Whether you’re modernizing, downsizing, or simply looking for cost efficiency, AMD offers tools and expertise to guide the way. The AMD EPYC Advisory Suite can help you identify the right EC2 instance for your workload, and AMD works closely with AWS partners to deliver tailored solutions. Many organizations combine multiple strategies across different workloads to achieve maximum ROI. If you need help deciding what best fits your architecture, AMD and its partners are ready to assist. To offer feedback on this post or to suggest future topics, feel free to reach out at AWS@AMD.com.


Related Blogs
-
Spur: Modern GPU Job Scheduling for HPC and AI Workloads — ROCm Blogs
Explore how Spur addresses pain points in GPU cluster management and how Spur-Cloud extends the platform into a complete GPU-as-a-Service solution.
July 21, 2026
-
Scaling MiniMax-M3 Inference with Distributed Serving and Operator Co-Design on AMD Instinct MI355X GPUs — ROCm Blogs
Optimize MiniMax-M3 inference on AMD Instinct™ MI355X GPUs with ATOM online quantization, AITER sparse attention, FP8 KV cache, and EAGLE3.
July 20, 2026
-
What to Expect at AMD Advancing AI 2026
Get a preview of AMD Advancing AI 2026, including key themes, sessions, and innovations shaping the future of AI. Discover how industry leaders are coming together to explore real-world use cases and strategies for scaling AI across the enterprise.
July 14, 2026
-
Triton-Based Optimization of Video Sparse Attention on ROCm — ROCm Blogs
Optimize video sparse attention on ROCm with GEAK and linear global context for faster, more stable video generation on AMD GPUs.
July 12, 2026
-
QuickReduce INT3 Quantization and Benchmarking on MI355 — ROCm Blogs
Learn how QuickReduce uses INT3 quantization to accelerate all-reduce communication and evaluate its performance and accuracy on AMD Instinct MI355 GPUs.
July 12, 2026
-
SGLang-ATOM: Bring ROCm-Native Acceleration to SGLang Serving — ROCm Blogs
Explore how SGLang-ATOM connects SGLang serving applications with ROCm-native ATOM execution to accelerate LLM inference on AMD Instinct GPUs.
July 07, 2026
-
Why Open Software Matters for Enterprise AI
Open software is helping enterprises move AI from experimentation to production. Discover how open ecosystems, transparent frameworks, and AMD ROCm™ software enable organizations to accelerate innovation, maintain flexibility, and build AI strategies for long-term success.
June 29, 2026
-
Accelerating LLM Inference on AMD GPUs with Low-Latency GEMMs — ROCm Blogs
Learn how FlyDSL low-latency GEMMs speed up LLM decode on AMD GPUs with Split-K, K-slice parallelism, and an LDS-based pipeline.
June 28, 2026