AT&T
AT&T trains telecom AI on AMD Instinct™ MI355X GPUs, running a full model on a single GPU to power inference for millions of customers.

At AMD, energy efficiency has long been a guiding core design principle aligned to our roadmap and product strategy. For more than a decade, we have set public, time-bound goals to dramatically increase energy efficiency across the breadth of our portfolio and have consistently met and exceeded those targets.
As AI continues to scale, and as we move toward true end-to-end design of full AI systems, the need for innovative energy solutions is becoming increasingly important, perhaps nowhere more so than in the data center.

*For illustrative purposes. See data table in footnote.
AMD set a bold new target: a 20x increase in rack-scale energy efficiency for AI training and inference by 2030, from a 2024 base year.1 AMD estimates this goal exceeds the industry improvement trend from 2018 to 2025 by almost 3x. This reflects performance-per-watt improvements across the entire rack, including CPUs, GPUs, memory, networking, storage and hardware-software co-design, based on our latest designs and roadmap projections. This shift from node to rack is made possible by our rapidly evolving end-to-end AI strategy and is key to scaling datacenter AI in a more sustainable way.
Status Update: AMD estimates a 4x increase in rack-level energy efficiency for AI training and inference from 2024 to 20262.

A 20x rack-scale efficiency increase at nearly 3x the prior industry rate has major implications. Based on a representative AI training workload, AMD’s projected rack-scale energy efficiency gains are expected to produce two related benefits by 20303:
These projections are based on AMD silicon and system design roadmap and a measurement methodology validated by energy-efficiency expert Dr. Jonathan Koomey.
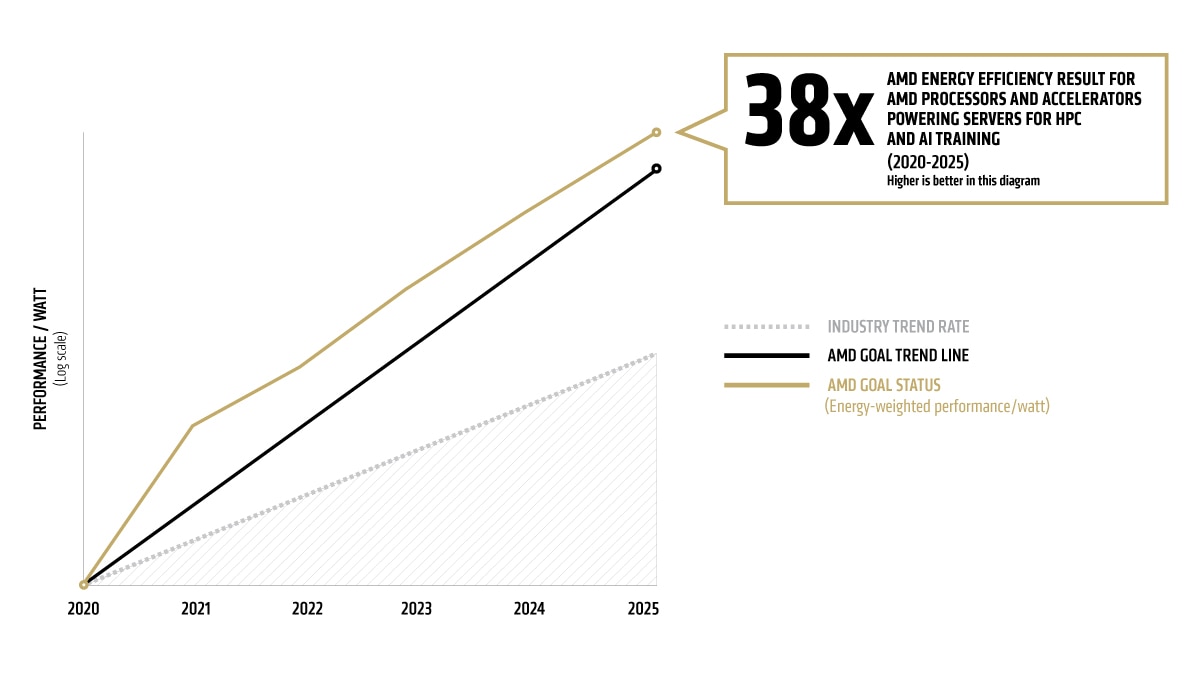
*For illustrative purposes. See data table in footnote.
In 2025, AMD surpassed our 30x25 goal to improve the energy e¬fficiency of AI training and HPC nodes by 30x from 2020 to 2025.4 This goal represented more than a 2.5x acceleration over industry trends from 2015 to 2020. A system configured with four AMD Instinct™ MI355X GPUs and one 5th Gen AMD EPYC™ CPU achieved a 38x increase over the base system.5 This equates to a 97% reduction in energy use for the same compute performance over the goal period. Architectural innovation and performance-per-watt optimization enabled these gains across our CPU and GPU product lines.
AMD based advanced racks for AI training/inference in each year (2024 - 2030) on AMD roadmaps, also examining historical trends to inform rack design choices and technology improvements aligned with projected goals and historical trends. The 2024 rack is based on the MI300X node which reflects typical AI deployments in the 2024/2025 time frame. The 2030 rack will be based on an AMD system and silicon design expectations for that time frame. AMD specified components like GPUs, CPUs, DRAM, network switches, storage, cooling, and communications, tracking components and total rack characteristics for power and performance based on AMD experience and observed customer deployments with specification sheet power values for GPU, CPU, DRAM and scale-up switches. Calculations do not include power used for cooling air or water supply outside the racks but do include power for fans and pumps internal to the racks. When power values were not available via specification sheet power values, chief technologist engineering judgment was used for estimates. Annual performance improvements are estimated based on progress in compute output (delivered, sustained, not peak FLOPS), peak memory (HBM) bandwidth, and network (scale-up) bandwidth, expressed as indices and weighted by the factors in Table 1 for training and inference, which have been updated in FY26 based on experience with more recent rack configurations and model behaviors. These factors capture interactive effects and reflect actual customer deployments running typical AI workloads. These estimates are based on AMD rack-level performance modeling.
Table 1: Weighting factors across GPU performance drivers
|
FLOPS |
HBM BW |
Scale-up BW |
Training |
70% |
10% |
20% |
Inference |
35% |
50% |
15% |
For measured FLOPs at different precision levels for each GPU, AMD uses published, Maximum Achievable FLOPs (MAF). These performance values were measured by AMD under AMD benchmark protocols. For HBM and scale-up bandwidth per GPU, AMD uses published peak numbers in device product datasheets available on AMD.com. Actual delivered numbers usually are within 10%, so for comparison purposes (generational gains), using peak numbers is expected to provide reasonable accuracy. The measured FLOPs numbers assume continued AI model progress in exploiting lower precision math formats for both training and inference, which results in both an increase in effective FLOPS and a reduction in required energy per FLOP. Trends in precision for training are extrapolated from Epoch.ai data (https://epoch.ai/data-insights/training-precision). Inference trends were determined by engineering judgement given industry guidance over time.
Performance and power use per rack together imply trends in performance per watt over time for training and inference, then indices for progress in training and inference are weighted 50:50 to get the final estimate of AMD projected progress by 2030 (20x).
We commissioned Dr. Koomey to analyze historical industry data and projected AMD data on compute performance and power consumption. We then engaged Dr. Koomey to refine a goal methodology aligned with industry-accepted best practices for efficiency assessments. This methodology allows us to compare our goal to historical industry gains, track our progress against the goal over time, and to estimate environmental benefits of achieving the goal in real world AI deployment.
To estimate trends in performance per watt for AMD-based rack configurations, we estimate power use and weighted performance delivered for components in a typical, customer-configured rack each year. AMD specified components like GPUs, CPUs, DRAM, network switches, storage, cooling, and communications, tracking components and total rack characteristics for power and performance based on AMD experience and observed customer deployments with specification sheet power values for GPU, CPU, DRAM and scale-up switches. Calculations do not include power used for cooling air or water supply outside the racks but do include power for fans and pumps internal to the racks. When power values were not available via specification sheet power values, chief technologist engineering judgement was used for estimates. We then divide the index of performance by the index of power (watts), both relative to our baseline 2024 rack, to derive an improvement index for performance per watt.
Table 1 represents Floating Point Operations by precision over time, referencing Epoch.ai trends. 2024 and 2025 are sourced from the trend table and 2026 value is extrapolated from the trend table. Inference values are estimated from industry trends and engineering judgement.
|
MI300X (2024) |
MI355X (2025) |
MI455X (2026) |
|||
|
Training |
Inference |
Training |
Inference |
Training |
Inference |
% BF16 flops |
93% |
66% |
84% |
38% |
65% |
15% |
% FP8 flops |
7% |
34% |
16% |
48% |
32% |
45% |
% FP4 flops |
0% |
0% |
0% |
15% |
3% |
40% |
% new flops |
0% |
0% |
0% |
0% |
0% |
0% |
Table 2 reflects the progress to goal, comparing our goal trend line to the status for each AI accelerator model. The baseline (2024) rack uses AMD MI300X AI nodes, the 2025 rack is based on the AMD MI355X, and the 2026 rack is based on the AMD MI455X. Each one reflects a common GPU in AI deployments for the associated time frame. MI300X and MI355X performance to goal is calculated using published measured maximum Floating Point Operations at different precision levels for each GPU performance. At the time of this report’s publication (mid-August 2026), comprehensive MI455X performance values were not available and therefore a combination of measured maximum flops and modeled data was used, as approved by our chief technologist. AMD expects final measured results to be within 5% of the modeled estimate, and upon receiving final measured data, the 2026 performance to goal verification will be confirmed.
|
2024 |
2025 |
2026 |
2027 |
2028 |
2029 |
2030 |
Goal Trend Line |
1.0 |
1.9 |
3.2 |
5.2 |
8.4 |
12.3 |
20 |
AMD Goal Status |
1.0 |
1.7 |
4.0 |
|
|
|
|
AMD Instinct™ GPU |
MI300X |
MI355X |
MI455X |
|
|
|
|
To estimate the number of racks to train a typical 2025 AI model, we assume, based on Epoch.ai data on total compute for notable models over time (https://epoch.ai/), that a typical model takes 9.87x10^24 operations to train in 2025 (based on a regression on the data), and that this training takes place over 2 weeks. The compute performance estimates from the AMD roadmap suggest that about 570 racks would be needed with 2024 racks to train a typical model over two weeks with the above assumptions, and about two 2030 racks would be needed to train the same model in 2030. These calculations imply an approximate 300-fold reduction in the number of racks to train the same model over this six-year period.
Because power density per rack increases over time, the total power consumed to generate a fixed quantity of compute is expected to decline 20x. Electricity use for a MI300X system to train a defined 2025 AI model using a 2024 rack is calculated at approximately 9.0 GWh, whereas the future 2030 AMD system could train the same model using approximately 450 MWh, a 95% reduction.
In addition to the reduction in electricity used to complete the representative task, it is assumed that electricity generation will become less emissions intensive over time. When combined, carbon emissions for this level of compute are expected to fall 28 times from 2024 to 2030. For the baseline of this calculation, AMD applied carbon intensities per kWh from the International Energy Agency World Energy Outlook 2024 [https://www.iea.org/reports/world-energy-outlook-2024]. IEA’s stated policy case gives carbon intensities for 2023 and 2030. We determined the average annual change in intensity from 2023 to 2030 and applied that to the 2023 intensity to get 2024 intensity (434 CO2 g/kWh) versus the 2030 intensity (312 CO2 g/kWh). Emissions for the 2024 baseline scenario of 9 GWh x 434 CO2 g/kWh equates to approximately 3900 CO2, versus the future 2030 scenario of 450 MWh x 312 CO2 g/kWh equates to around 140 CO2.
Includes high-performance CPU and GPU accelerators used for AI training and High-Performance Computing in a 4-Accelerator, CPU hosted configuration. Goal calculations are based on performance scores as measured by standard performance metrics (HPC: Linpack DGEMM kernel FLOPS with 4k matrix size; AI training: lower precision training-focused floating-point math GEMM kernels operating on 4k matrices) divided by the rated power consumption of a representative accelerated compute node including the CPU host + memory, and 4 GPU accelerators.
EPYC-030B: AMD takes compute node performance/watt measurements for AMD high performance CPU and GPU accelerators used for AI training and High-Performance Computing in a 4-Accelerator, CPU-hosted configuration.
Performance for HPC workloads is based on Linpack DGEMM kernel FLOPS with 4k matrix size. Performance for AI training is based on lower precision training-focused floating-point math GEMM kernels such as FP16 or BF16 FLOPS operating on 4k matrices.
Watts are based on the TDP of a representative accelerated compute node including the CPU host + memory, and 4 GPU accelerators
To make the goal particularly relevant to worldwide energy use, AMD worked with Koomey Analytics to assess available research and data that includes segment-specific datacenter power utilization effectiveness (PUE), including GPU HPC and machine learning (ML) installations. The AMD CPU socket and GPU node power consumptions incorporate segment-specific utilization (active vs. idle) percentages and are multiplied by PUE to determine actual total energy use for calculation of the performance per watt.
The energy consumption baseline uses the same industry energy per operation improvement rates as were observed from 2015-2020, with this rate of change extrapolated to 2025. The AMD goal trend line (Table 1) shows the exponential improvements needed to hit the goal of 30-fold efficiency improvements by 2025. The actual AMD products released (Table 2) are the source of the efficiency improvements shown for AMD goal status in Table 1.
The measure of energy per operation improvement in each segment from 2020-2025 is weighted by the projected worldwide volumes (as per IDC - Q1 2021 Tracker Hyperion - Q4 2020 Tracker, Hyperion HPC Market Analysis, April ’21). Translating these volumes to the ML training and HPC markets results in node volumes as per Table 3 below. These volumes are then multiplied by the Typical Energy Consumption (TEC) of the respective computing segment in 2025 (Table 4) to arrive at a meaningful aggregate metric of actual energy usage improvement worldwide.
|
2020 |
2021 |
2022 |
2023 |
2024 |
2025 |
Goal Trend Line |
1.00 |
1.97 |
3.98 |
7.70 |
15.20 |
30.00 |
AMD Goal Status (energy-weighted performance / watt) |
1.00 |
3.90 |
6.79 |
13.49 |
28.29 |
37.85 |
2020 |
2021 |
2022 |
2023 |
2024 |
2025 |
| EPYC Gen 1 CPU +M50 GPU | EPYC Gen 2 CPU + MI100 GPU |
EPYC Gen 3 CPU +MI250 GPU | MI300A APU (4th Gen AMD EPYC™ CPU with AMD CDNA™ 3 Compute Units) |
EPYC Gen 5 CPU + MI300X GPU |
EPYC Gen 5 CPU + MI355X GPU |
*AMD Products are supported by the latest software, including AMD ROCm.
|
2020 |
2021 |
2022 |
2023 |
2024 |
2025 |
HPC GPU nodes sold |
0.05 |
0.06 |
0.07 |
0.09 |
0.10 |
0.12 |
ML GPU nodes sold |
0.09 |
0.10 |
0.12 |
0.14 |
0.17 |
0.20 |
|
2025 |
Base HPC |
4.49 |
Base ML |
29.79 |
Total Base |
34.28 |
* Estimated values for 2025 on worldwide energy use are updated annually as HPC and ML compute node capabilities evolve from our original outlook, including with the growth of AI increasing the weighting for ML performance.