HMx Labs Optimizes Financial Services High Performance Computing (HPC) Workloads on AMD EPYC CPUs
Oct 07, 2025

Over the past couple of years, HMx Labs has published a plethora of benchmarking data and insights across a vast array of hardware platforms with the goal of providing informed hardware recommendations to their customers for high performance computing workloads targeting the financial services sector.
In addition to posting informative benchmarking findings via LinkedIn and continuing to publish chapters of his book, Hamza Mian, CEO and Founder of HMx Labs, has also recently released alongside his team a comprehensive whitepaper describing how one would optimize financial services HPC workloads on 4th and 5th Generation AMD EPYC™ CPUs.
While this blog post intends to excerpt some messaging from the whitepaper, it is encouraged that readers reference the full whitepaper linked here from the HMx Labs website.
The benchmark of focus for the whitepaper is COREx. Most financial institutions leverage proprietary mathematical algorithms that are not publicly accessible for benchmarking purposes. As a result, a proxy benchmark is needed to represent real-life workloads accurately enough to be relevant to enterprises in the financial services sector. COREx builds upon the open-source financial analytics library, QuantLib, which AMD has published benchmarking data on before. While many practitioners test QuantLib by running only the unit tests it contains, COREx simulates a real risk system by also leveraging Open Source Risk Engine for the calculation of market risk across a variety of sectors and trade types. From a design perspective, COREx is intended to primarily represent end-of-day risk use cases, maximizing overall compute utilization as opposed to optimizing for latency as one would for intraday risk applications.
As part of their analysis, HMx Labs benchmarked and documented COREx results across different settings and different types of AMD EPYC CPU-based hardware. The bare metal data was collected on 2P platforms; the cloud virtual machines tested were across Amazon Web Services (AWS), Google Cloud, and Microsoft Azure.
In summary:
1. Notable Impact of Simultaneous Multithreading (SMT): While enabling Simultaneous Multithreading does not guarantee performance uplift for all HPC workloads, SMT is observed to improve system level performance of COREx at the expense of higher peak power usage (on measurable on-prem systems tested by HMx Labs).

Figure 9 above is excerpted from the HMx Labs whitepaper linked here. This graph represents system-level COREx scores, where a higher score (represented by the x-axis) is better. When SMT is enabled across the AMD EPYC 9755 and AMD EPYC 9654 systems, system level performance improvements of 12% and 15%, respectively, are observed.

Figure 24 above is excerpted from the HMx Labs whitepaper linked here. This graph represents system-level power consumption at idle and peak load, measured in Watts (x-axis). As evidenced by this graph, both AMD processors consume higher peak power with SMT enabled than with SMT disabled.
That said, AMD EPYC 9755 is observed to be more energy efficient than AMD EPYC 9654 when running COREx. This can be extrapolated by the graph below, excerpted from the HMx Labs whitepaper linked here (Figure 26), wherein the x-axis represents the total amount of energy consumed (Joules) per COREx process. Since lower [energy consumption] is better, one can conclude that, for COREx, AMD EPYC 9755, with SMT enabled or disabled, is more energy efficient per process than AMD EPYC 9654.
2. Generational Improvement from 4th to 5th Gen AMD EPYC Processors: After testing with both top-of-stack CPU parts from each AMD EPYC processor generation, AMD EPYC 9755 (5th Gen AMD EPYC, 128 cores) was observed to outperform AMD EPYC 9654 (4th Gen AMD EPYC, 96 cores) at a system level by 63% with SMT enabled and 67% with SMT disabled.
Figure 9 above is excerpted from the HMx Labs whitepaper linked here. This graph represents system-level COREx scores, where a higher score (represented by the x-axis) is better. When comparing AMD EPYC 9755 and AMD EPYC 9654 with SMT enabled, one observes a system-level performance uplift with SMT enabled of 63%. When SMT is disabled for both systems, the generational uplift is observed to be 67%.
Since some of the system-level performance can be attributed to the increase in core count (from 96 cores with AMD EPYC 9654 to 128 cores with AMD EPYC 9755 at the top-of-stack for both generations), it is worthwhile to discuss the per core generational performance uplift as well. As one might expect, the % improvements are smaller on a per core basis, with a generational improvement of 22% from AMD EPYC 9654 to AMD EPYC 9755 with SMT enabled and 25% with SMT disabled.

Figure 10 above is excerpted from the HMx Labs whitepaper linked here. This graph represents COREx scores normalized per CPU core, where a higher score (represented by the x-axis) is better. With SMT enabled for both, a single logical CPU (thread) of AMD EPYC 9755 outperforms the same on AMD EPYC 9654 by 22%. With SMT disabled for both, a single AMD EPYC 9755 core outperforms a single AMD EPYC 9654 core by 25%.
3. Variation in Performance Between Bare Metal Hardware and Cloud Virtual Machines: In their sweep of “Zen 4” and “Zen 5”-based cloud instance testing across AWS, Google Cloud, and Microsoft Azure, HMx Labs concluded that there is no basis for the perception that bare metal platforms consistently outperform cloud virtual machines.
Notably, figures 12 and 13 in the HMx Labs whitepaper linked here compare COREx scores with SMT enabled and disabled, respectively, across AMD EPYC 9654 and 9755 (bare metal) and several AMD-based instances offered by AWS, Google Cloud, and Microsoft Azure. In Figure 12, where SMT is enabled, the benchmark scores are normalized per CPU thread (SMT=on) or vCPU (1 CPU thread = 1 vCPU). In Figure 13, where SMT is disabled, the benchmark scores are normalized per CPU core (SMT=off) or vCPU (where 1 CPU core = 1 vCPU). In both of these figures, a higher score is better.
However, HMx Labs noted that their benchmarking results in this whitepaper are constrained to performance comparisons only, not accounting for pricing differences across Cloud Service Providers (CSPs) nor pricing differences between cloud instances and bare metal systems. It is also important to note that the impact of network latency on performance of the cloud instances is not isolated in these displayed results.
As an additional caveat, implementation details of these virtual instances are often not made publicly available, so attribution of specific results to possible differences in hardware configuration, CPU specification, or hypervisor is challenging. With what information is accessible in the public domain, HMx Labs hypothesizes the contributors to some of the observed performance discrepancies in their whitepaper.
Further in their analysis, HMx Labs notes that the COREx score continues to increase until the number of COREx processes exceeds the traditional limit of 1 process per thread/logical CPU, after which point performance degradation is observed. This is reported to be characteristic of many CPU bound processes, including COREx.
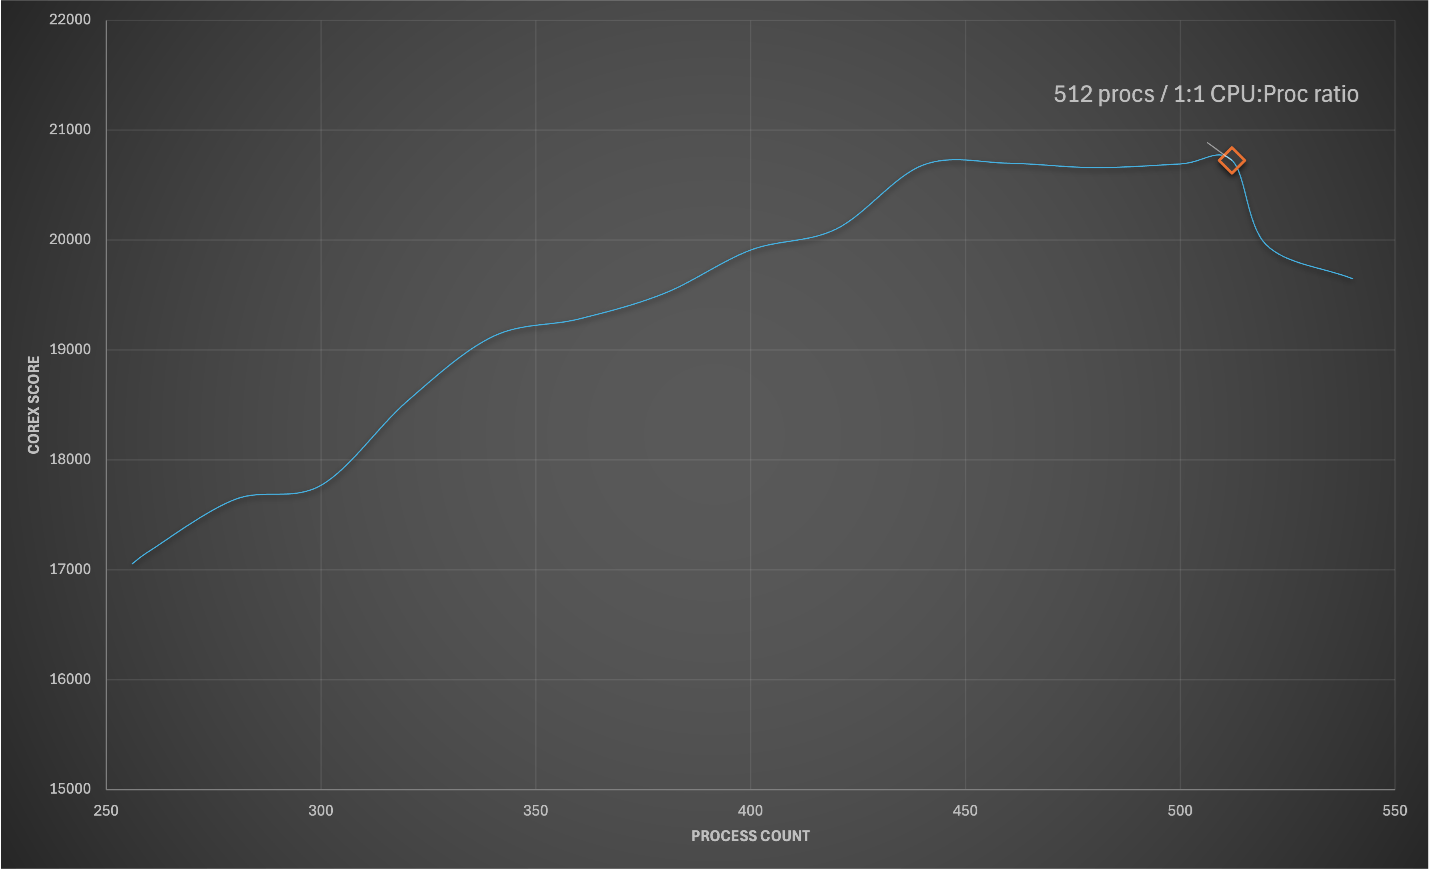
Figure 14 above is excerpted from the HMx Labs whitepaper linked here. The x-axis represents the number of COREx processes, while the y-axis represents the COREx score (higher is better). As observed by HMx Labs, increasing the process count increases the COREx score up until the number of logical CPUs available on the system is reached. After that point (512 processes in total for the 2P AMD EPYC 9755 system in the above graph; 128 cores per processor = 256 threads per processor), performance decreases.
While the above phenomenon is suitable for finding the limits of performance for throughout-oriented workloads such as end-of-day risk, HMx Labs’ whitepaper concludes with a discussion of how one might improve system responsiveness for latency-sensitive interactive risk use cases by allocating/partitioning dedicated resource groups at the cost of lower overall CPU utilization.
To review all the benchmarking data and associated analysis in greater detail, please refer to the HMx Labs whitepaper here.
Disclaimers:
- COREx benchmarking was conducted and reported out by HMx Labs alone. AMD did not independently verify the COREx benchmarking results documented in the whitepaper.
- Access to the bare metal AMD EPYC 9755 and AMD EPYC 9654 systems was provided to HMx Labs by AMD at no charge.
- Access to all cloud resources referenced in the whitepaper was paid for by HMx Labs.

Related Blogs
-
AMD Expands AMD Ryzen™ PRO 9000 Series Processor Lineup
AMD announced expanded Ryzen™ PRO 9000 Series workstation processors, bringing new AI and high-performance computing capabilities to commercial desktops.
May 12, 2026
-
Expanding the AMD Ryzen™ PRO 9000 Series Processor Lineup: Powering the Next Generation of Performance Workstations
The expanded AMD Ryzen™ PRO 9000 Series processor lineup is designed to meet the evolving demands of modern professional workflows.
May 12, 2026
-
AMD sets new bar for HPC with AMD Instinct MI430X GPU FP64 performance
AMD at HPC User Forum 2026 highlights AMD Instinct ™ MI430X GPU FP64 performance and its role in advancing AI-for-science and HPC.
May 06, 2026
-
Styled Text Image Generation with Eruku on AMD — ROCm Blogs
Hands-on, reproducible guide to train and run Eruku on LUMI supercomputer, powered by AMD Instinct MI250X GPUs.
April 23, 2026
-
Dayhoff Health, AMD Accelerate Genomic Analysis by up to 330x
How Dayhoff Health used AMD ROCm™ and a Radeon AI PRO 9700 to move genomic analysis from CPUs to GPUs, boosting microbiome, WGS, and single-cell workloads.
April 09, 2026
-
OpenFold3 Meets AMD Instinct™ GPUs: Unlocking Scalable, High-Throughput Structural Biology
Study disease, develop therapeutics, and engineer biology with tools that capture interactions fast, accurate, and at scale powered by OpenFold3 and AMD Instinct GPUs.
April 09, 2026
-
GROMACS on AMD Instinct GPUs: A Complete Build Guide — ROCm Blogs
Build GROMACS with HIP, UCX, and OpenMPI on AMD MI300X/MI355X — covering bare metal, Apptainer, and Docker deployments.
March 23, 2026
-
GROMACS Performance on AMD Instinct MI355X — ROCm Blogs
Explore GROMACS molecular dynamics performance benchmarks on AMD Instinct MI355X GPUs with HIP acceleration.
March 12, 2026