Introducing 5th Gen AMD EPYC Server CPUs

Purpose built to accelerate data center, cloud, and AI workloads; the AMD EPYC 9005 server CPUs are driving new levels of enterprise computing performance.   

The Leading CPU for AI1

AMD EPYC™ 9005 server CPUs provide end-to-end AI performance.

Maximizing Per-Server Performance

AMD EPYC™ 9005 CPUs can match integer performance of legacy hardware with up to 88% fewer racks2, dramatically reducing physical footprint, power consumption, and the number of software licenses needed, freeing up space for new or expanded AI workloads.

Leadership AI Inference Performance

Many AI workloads—language models with 13 billion parameters and below, image and fraud analysis, or recommendation systems run efficiently on CPU-only servers that feature AMD EPYC™ 9005 CPUs. Servers running two 5th Gen AMD EPYC 9965 CPUs offer up to 2x inference throughput when compared to previous generation offerings.3

Maximizing GPU Acceleration

The AMD EPYC™ 9005 family includes options that are optimized to be host-CPUs for GPU-enabled systems to help increase performance on select AI workloads and improve the ROI of each GPU server. For example, in geomean inference performance tests across 8 models and 4 use cases, a high‑frequency AMD EPYC 9575F CPU-based server with 8 GPUs delivers up to 13% faster time‑to‑first‑token and 6.6% higher overall inference throughput than an equivalent 8 GPU server powered by Intel Xeon 6960P CPUs.4,5,6

Learn how 5th Generation AMD EPYC processors help drive efficiency and performance for AI across the data center. From creating space and power in your data center, to running inference directly on the CPU to improving performance on GPUs, AMD EPYC processors advance enterprise AI to new heights

Enterprise Performance, Optimized

AMD EPYC 9005 server CPUs deliver exceptional performance while enabling leadership energy efficiency and cost-of-ownership (TCO) value in support of key business imperatives.

Industry Leading Integer Performance

AMD EPYC 9005 CPU-powered servers leverage the new “Zen 5” cores to offer compelling mainstream performance metrics, including 2.3x the integer performance when compared to leading competitive offerings.7

Built for the Cloud

AMD EPYC™ 9005 server CPUs provide density and performance for cloud workloads. With 192 cores, the top-of-stack AMD EPYC 9965 processor will support 33% more virtual CPUs (vCPUs) than the leading available Intel® Xeon 6E “Sierra Forest” 144 core processor (1 core per vCPU).

Leadership Efficiency and TCO

Data centers are demanding more energy than ever. AMD EPYC™ 9005 server CPUs continue to provide the energy efficiency and TCO benefits found in previous AMD EPYC generations. 

Leadership Performance, Density, and Efficiency

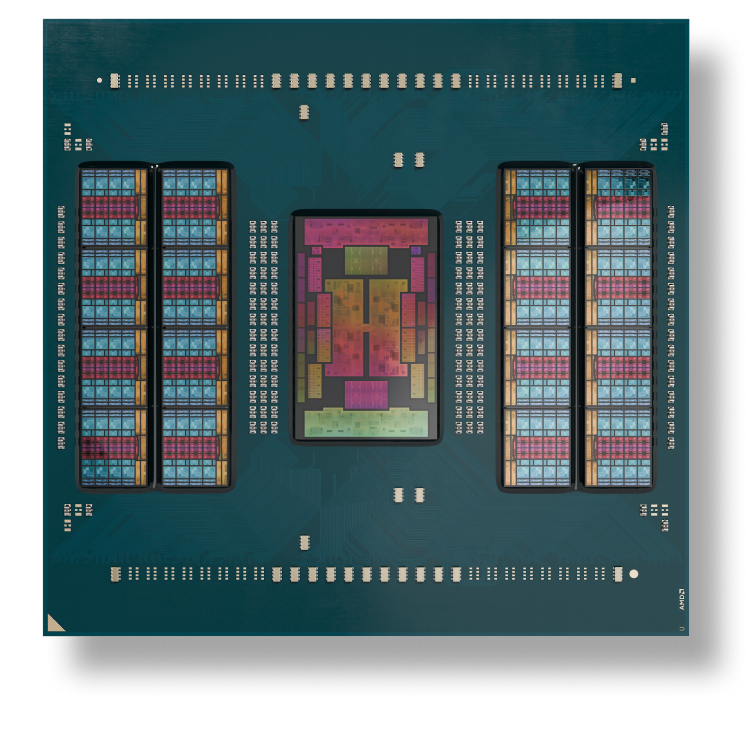
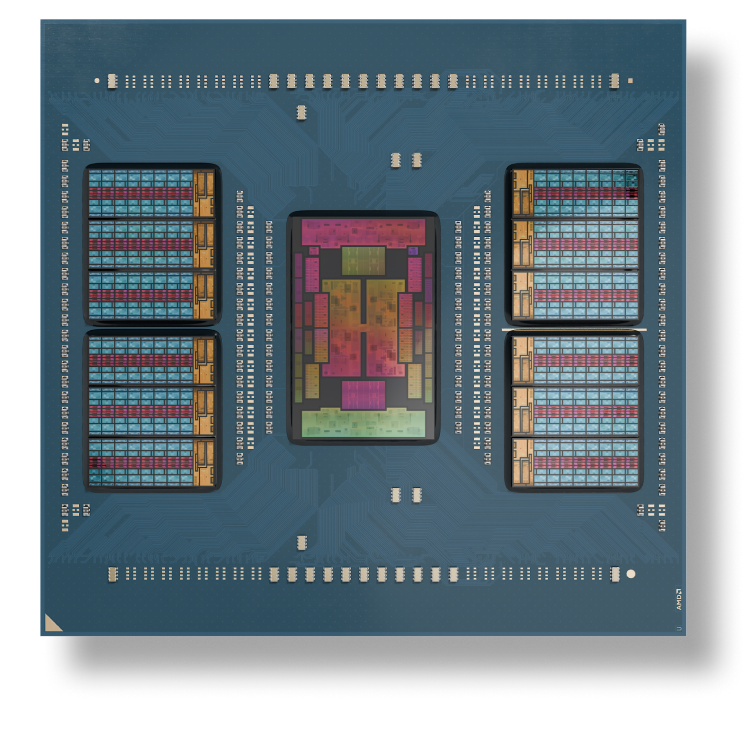
AMD EPYC 9005 Series server CPUs include up to 192 “Zen 5” or “Zen 5c” cores with exceptional memory bandwidth and capacity.  The innovative AMD chiplet architecture enables high performance, energy-efficient solutions optimized for your different computing needs.

“Zen 5”

AMD Zen 5 chip

“Zen 5c”

AMD Zen 5c chip

Broad Ecosystem Support, Trusted by Industry Leaders

AMD collaborates with a broad network of solution providers featuring AMD EPYC™ 9005 server CPUs. Companies and government organizations around the globe choose AMD for their most important workloads.

Model Specifications

Resources

Footnotes
  1. 9xx-151: TPCxAI @SF30 Multi-Instance, 32C Instance Size throughput results based on AMD internal testing as of 04/01/2025 running multiple VM instances. The aggregate end-to-end AI throughput test is derived from the TPCx-AI benchmark and as such is not comparable to published TPCx-AI results, as the end-to-end AI throughput test results do not comply with the TPCx-AI Specification. 2P AMD EPYC 9965 (6067.53 Total AIUCpm, 384 Total Cores, 500W TDP, AMD reference system, 1.5TB 24x64GB DDR5-6400, 2 x 40 GbE Mellanox CX-7 (MT2910), 3.84TB Samsung MZWLO3T8HCLS-00A07 NVMe, Ubuntu® 24.04 LTS kernel 6.13, SMT=ON, Determinism=power, Mitigations=on) 2P AMD EPYC 9755 (4073.42 Total AIUCpm, 256 Total Cores, 500W TDP, AMD reference system, 1.5TB 24x64GB DDR5-6400, 2 x 40 GbE Mellanox CX-7 (MT2910) 3.84TB Samsung MZWLO3T8HCLS-00A07 NVMe, Ubuntu 24.04 LTS kernel 6.13, SMT=ON, Determinism=power, Mitigations=on) 2P Intel Xeon 6980P (3550.50 Total AIUCpm, 256 Total Cores, 500W TDP, Production system, 1.5TB 24x64GB DDR5-6400, 4 x 1GbE Broadcom NetXtreme BCM5719 Gigabit Ethernet PCIe 3.84TB SAMSUNG MZWLO3T8HCLS-00A07 NVMe, Ubuntu 24.04 LTS kernel 6.13, SMT=ON, Performance Bias, Mitigations=on) Results may vary based on factors including but not limited to system configurations, software versions, and BIOS settings. TPC, TPC Benchmark, and TPC-H are trademarks of the Transaction Processing Performance Council.
  2. 9xx5TCO-018: This scenario contains many assumptions and estimates and, while based on AMD internal research and best approximations, should be considered an example for information purposes only, and not used as a basis for decision making over actual testing. The AMD Server & Greenhouse Gas Emissions TCO (total cost of ownership) Estimator Tool - version 1.53, compares the selected AMD EPYC™ and Intel® Xeon® CPU based server solutions required to deliver a TOTAL_PERFORMANCE of 391,000 units of SPECrate2017_int_base performance as of December 3, 2025. This analysis compares a 2P AMD 192 core EPYC_9965 powered server with a SPECrate2017_int_base score of 3230, https://spec.org/cpu2017/results/res2025q2/cpu2017-20250324-47086.pdf;
    compared to a 2P Intel Xeon 128 core Xeon_6980P based server with a SPECrate2017_int_base score of 2510, https://spec.org/cpu2017/results/res2025q2/cpu2017-20250324-47099.pdf; versus legacy 2P Intel Xeon 28 core Platinum_8280 based server with a SPECrate2017_int_base score of 391, https://spec.org/cpu2017/results/res2020q3/cpu2017-20200915-23984.pdf
    Environmental impact estimates made leveraging data from the 2025 International Country Specific Electricity Factors and can be found at https://www.carbondi.com/#electricity-factors/ and the US EPA Greenhouse Gas Equivalencies Calculator used in this analysis was sourced on 09/04/2024 and can be found at https://www.epa.gov/energy/greenhouse-gas-equivalencies-calculator.
    For additional details, see https://www.amd.com/en/legal/claims/epyc.html#q=9xx5TCO-018.
  3. 9xx5-040A: XGBoost (Runs/Hour) throughput results based on AMD internal testing as of 09/05/2024. XGBoost Configurations: v2.2.1, Higgs Data Set, 32 Core Instances, FP32 2P AMD EPYC 9965 (384 Total Cores), 12 x 32 core instances, 1.5TB 24x64GB DDR5-6400 (at 6000 MT/s), 1.0 Gbps NetXtreme BCM5720 Gigabit Ethernet PCIe, 3.5 TB Samsung MZWLO3T8HCLS-00A07 NVMe®, Ubuntu® 22.04.4 LTS, 6.8.0-45-generic (tuned-adm profile throughput-performance, ulimit -l 198078840, ulimit -n 1024, ulimit -s 8192), BIOS RVOT1000C (SMT=off, Determinism=Power, Turbo Boost=Enabled), NPS=1 2P AMD EPYC 9755 (256 Total Cores), 1.5TB 24x64GB DDR5-6400 (at 6000 MT/s), 1DPC, 1.0 Gbps NetXtreme BCM5720 Gigabit Ethernet PCIe, 3.5 TB Samsung MZWLO3T8HCLS-00A07 NVMe®, Ubuntu 22.04.4 LTS, 6.8.0-40-generic (tuned-adm profile throughput-performance, ulimit -l 198094956, ulimit -n 1024, ulimit -s 8192), BIOS RVOT0090F (SMT=off, Determinism=Power, Turbo Boost=Enabled), NPS=1 2P AMD EPYC 9654 (192 Total cores), 1.5TB 24x64GB DDR5-4800, 1DPC, 2 x 1.92 TB Samsung MZQL21T9HCJR-00A07 NVMe®, Ubuntu 22.04.4 LTS, 6.8.0-40-generic (tuned-adm profile throughput-performance, ulimit -l 198120988, ulimit -n 1024, ulimit -s 8192), BIOS TTI100BA (SMT=off, Determinism=Power), NPS=1 Versus 2P Xeon Platinum 8592+ (128 Total Cores), AMX On, 1TB 16x64GB DDR5-5600, 1DPC, 1.0 Gbps NetXtreme BCM5719 Gigabit Ethernet PCIe, 3.84 TB KIOXIA KCMYXRUG3T84 NVMe®, Ubuntu 22.04.4 LTS, 6.5.0-35 generic (tuned-adm profile throughput-performance, ulimit -l 132065548, ulimit -n 1024, ulimit -s 8192), BIOS ESE122V (SMT=off, Determinism=Power, Turbo Boost = Enabled) Results: CPU Run 1 Run 2 Run 3 Median Relative Throughput Generational 2P Turin 192C, NPS1 1565.217 1537.367 1553.957 1553.957 3 2.41 2P Turin 128C, NPS1 1103.448 1138.34 1111.969 1111.969 2.147 1.725 2P Genoa 96C, NPS1 662.577 644.776 640.95 644.776 1.245 1 2P EMR 64C 517.986 421.053 553.846 517.986 1 NA Results may vary due to factors including system configurations, software versions and BIOS settings.
  4. 9xx5-258: GPU Inference throughput results based on AMD internal testing as of 10/24/2025. Workload Configs: vLLM version, NIM version, Input/Output Tokens: 128/128, 1024/128, 128/1024, 1024/1024, results in tokens per second 2P AMD EPYC 9575F (128 Total Cores) production system with 8x NVIDIA B200 GPUs, 24x64GB DDR5-6400, SAMSUNG MZWLO3T8HCLS-00A07 3.84 TB NVMe, Ubuntu 24.04 6.8.0-85-generic, BIOS 1.5, SMT OFF, Mitigations OFF, Power Determinism, CUDA 13.0, NPS1 2P Intel Xeon 6960P (128 Total Cores) production system with 8x NVIDIA B200 GPUs, 24x64GB DDR5-6400, SAMSUNG MZWLO3T8HCLS-00A07 3.84 TB NVMe, Ubuntu 24.04 6.8.0-85-generic, BIOS 1.2, SMT OFF, Mitigations OFF, Power Determinism, CUDA 13.0, NPS1 Results: Framework Model Relative NIM llama3.3-70b-instruct 1.053 NIM gpt-oss-120b 1.133 NIM qwen2_5-coder-32b-instruct 1.034 VLLM Vllm_Deepseek_V3(R1) 1.036 VLLM Vllm_Llama4_scout 1.049 VLLM Vllm_Qwen2.5-VL-72B-Instruct 1.073 NIM Multi-instance llama3.1-8b-instruct 1.144 NIM Multi-instance qwen2_5-coder-32b-instruct 1.014 Overall Geomean 1.066 Best Result 1.144 Results may vary due to factors including system configurations, software versions and BIOS settings.
  5. 9xx5-259: GPU Inference Latency (Time to First Token) results based on AMD internal testing as of 10/24/2025. Workload Configs: vLLM version, NIM version, Input/Output Tokens: 128/128, 1024/128, 128/1024, 1024/1024, results in seconds 2P AMD EPYC 9575F (128 Total Cores) production system with 8x NVIDIA B200 GPUs, 24x64GB DDR5-6400, SAMSUNG MZWLO3T8HCLS-00A07 3.84 TB NVMe, Ubuntu 24.04 6.8.0-85-generic, BIOS 1.5, SMT OFF, Mitigations OFF, Power Determinism, CUDA 13.0, NPS1 2P Intel Xeon 6960P (128 Total Cores) production system with 8x NVIDIA B200 GPUs, 24x64GB DDR5-6400, SAMSUNG MZWLO3T8HCLS-00A07 3.84 TB NVMe, Ubuntu 24.04 6.8.0-85-generic, BIOS 1.2, SMT OFF, Mitigations OFF, Power Determinism, CUDA 13.0, NPS1 Results: Framework Model Relative NIM llama3.3-70b-instruct 0.996 NIM gpt-oss-120b 1.22 NIM qwen2_5-coder-32b-instruct 1.062 VLLM Vllm_Deepseek_V3(R1) 1.059 VLLM Vllm_Llama4_scout 1.246 VLLM Vllm_Qwen2.5-VL-72B-Instruct 1.164 NIM Multi-instance llama3.1-8b-instruct 1.355 NIM Multi-instance qwen2_5-coder-32b-instruct 1.012 Overall Geomean 1.133 Best Result 1.355 Results may vary due to factors including system configurations, software versions and BIOS settings.
  6. 9xx5-260: GPU Inference token latency (Time Per Output Token) results based on AMD internal testing as of 10/24/2025. Workload Configs: vLLM version, NIM version, Input/Output Tokens: 128/128, 1024/128, 128/1024, 1024/1024, results in seconds 2P AMD EPYC 9575F (128 Total Cores) production system with 8x NVIDIA B200 GPUs, 24x64GB DDR5-6400, SAMSUNG MZWLO3T8HCLS-00A07 3.84 TB NVMe, Ubuntu 24.04 6.8.0-85-generic, BIOS 1., SMT OFF, Mitigations OFF, Power Determinism, CUDA 13.0, NPS1 2P Intel Xeon 6960P (128 Total Cores) production system with 8x NVIDIA B200 GPUs, 24x64GB DDR5-6400, SAMSUNG MZWLO3T8HCLS-00A07 3.84 TB NVMe, Ubuntu 24.04 6.8.0-85-generic, BIOS 1.2, SMT OFF, Mitigations OFF, Power Determinism, CUDA 13.0, NPS1 Results: Framework Model Relative NIM llama3.3-70b-instruct 1.053 NIM gpt-oss-120b 1.128 NIM qwen2_5-coder-32b-instruct 1.019 VLLM Vllm_Deepseek_V3(R1) 1.025 VLLM Vllm_Llama4_scout 1.025 VLLM Vllm_Qwen2.5-VL-72B-Instruct 1.062 NIM Multi-instance llama3.1-8b-instruct 1.102 NIM Multi-instance qwen2_5-coder-32b-instruct 1.033 Overall Geomean 1.055 Best Result 1.128 Results may vary due to factors including system configurations, software versions and BIOS settings
  7. 9xx5-002F: SPECrate®2017_int_base comparison based on published scores from www.spec.org as of 12/11/2025.
    2P AMD EPYC 9654, 96C, 360W, $8452 USD, 1830, 5.083, 0.217, https://www.spec.org/cpu2017/results/res2025q3/cpu2017-20250727-49206.html
    2P AMD EPYC 9754, 128C, 360W, $10631 USD, 1950, 5.417, 0.183, https://www.spec.org/cpu2017/results/res2023q2/cpu2017-20230522-36617.html
    2P AMD EPYC 9755, 128C, 500W, $10931 USD, 2850, 5.70, 0.261, https://www.spec.org/cpu2017/results/res2025q4/cpu2017-20250928-49776.html
    2P AMD EPYC 9965, 192C, 500W, $11988 USD, 3230, 6.460, 0.269, https://www.spec.org/cpu2017/results/res2025q2/cpu2017-20250324-47086.html
    2P Intel Xeon 6780E, 144C, 330W, $8513 USD, 1420, 4.303, 0.167, https://www.spec.org/cpu2017/results/res2025q4/cpu2017-20251020-50067.html
    2P Intel Xeon 6980P, 128C, 500W, $12460 USD, 2510, 5.020, 0.201, https://www.spec.org/cpu2017/results/res2025q2/cpu2017-20250324-47099.html
    2P Intel Xeon Platinum 8592+, 64C, 350W, $11600 USD, 1130, 3.229, 0.097, https://www.spec.org/cpu2017/results/res2023q4/cpu2017-20231127-40064.html
    SPEC®, SPEC CPU®, and SPECrate® are registered trademarks of the Standard Performance Evaluation Corporation. See www.spec.org for more information. AMD CPU prices as of 12/11/2025. Intel CPU W and prices at https://ark.intel.com/ as of 12/11/2025