Competitive KX Nano Benchmarking on AMD EPYC Processors
Sep 04, 2025

Benchmarking in the financial services industry (FSI) can be challenging, as the majority of enterprises in this segment develop, deploy, and closely guard proprietary algorithms. The limited availability of publicly accessible codes poses a challenge for hardware vendors, including AMD, that are seeking to demonstrate the performance advantage that their products can enable. That said, there exist organizations that are responsible for industry-focused FSI benchmarks as well as a variety of independent software vendors (ISVs) that have developed and released open-source benchmarking suites to ultimately enable end customers to select the right infrastructure for their applications.
One such organization is the Strategic Technology Analysis Center (STAC), which maintains several FSI-relevant benchmarking suites, including the following, and regularly publishes audited results to its members:
STAC-M3, focused on solutions that enable high-speed analytics on time-series data, leverages the kdb+ time series database, developed by KX, and real-time analytics within its suite. KX is a high-performance analytical database provider, widely adopted across financial services institutions for high volume workloads. KX works with hardware vendors wishing to perform benchmarks.
In 2023, KX released the following blog on STAC-M3, highlighting speedups with 2nd generation AMD EPYC™ processors in Dell PowerEdge R7525 servers with Dell PowerScale F900 All-Flash Scale-Out NAS compared to earlier generations of Dell flash storage appliances and kdb+1,2,3.
More recently, KX demonstrated generational performance improvement when benchmarking their open-source KX Nano toolkit on AMD 4th and 5th Generation EPYC processors4.
This blog contains the results of competitive performance comparisons carried out by AMD between 4th and 5th Gen AMD EPYC processors versus 5th Gen and 6th Gen Intel® Xeon® processors.
Overview of KX Nano Benchmarking
KX Nano, an open-source suite, is both modular and extensible in its testing of storage, memory, and CPU capabilities, allowing hardware vendors to stress different components of a system in a reproducible manner.
The CPU-only KX Nano benchmarking conducted below can be categorized into 3 scenarios:
- Scenario 1: one kdb+ worker – one thread/kdb+ worker, which stresses the performance of a single core.
- Scenario 2: max kdb+ workers – one thread/kdb+ worker, which tests the performance of the entire system and deploys as many kdb+ workers as there are available threads in the system.
- Scenario 3: N kdb+ workers – M threads/kdb+ worker, which tests the performance of the entire system and allows for variation in the number of threads/kdb+ worker
Within each scenario, there are 2 test groups:
- CPU cache: stresses L1 and L2 cache
- Mem: stresses access to L3 cache and main memory
Each test group consists of 3 tests:
- CPU read
- CPU read-write
- CPU write
In total, there are 6 tests reported for each scenario for a total of 18 tests reported across all three scenarios tested.
Competitive Results Using KX Nano
For all tests below, the geomeans across all vector sizes were calculated and reported. Each result per vector size is itself averaged over three runs.
Server configuration information is detailed in the following section, “Systems Under Test”. KX Nano version 6.2.1 was used across all tests with kdb+ 4.1/2025.02.18.
Scenario 1
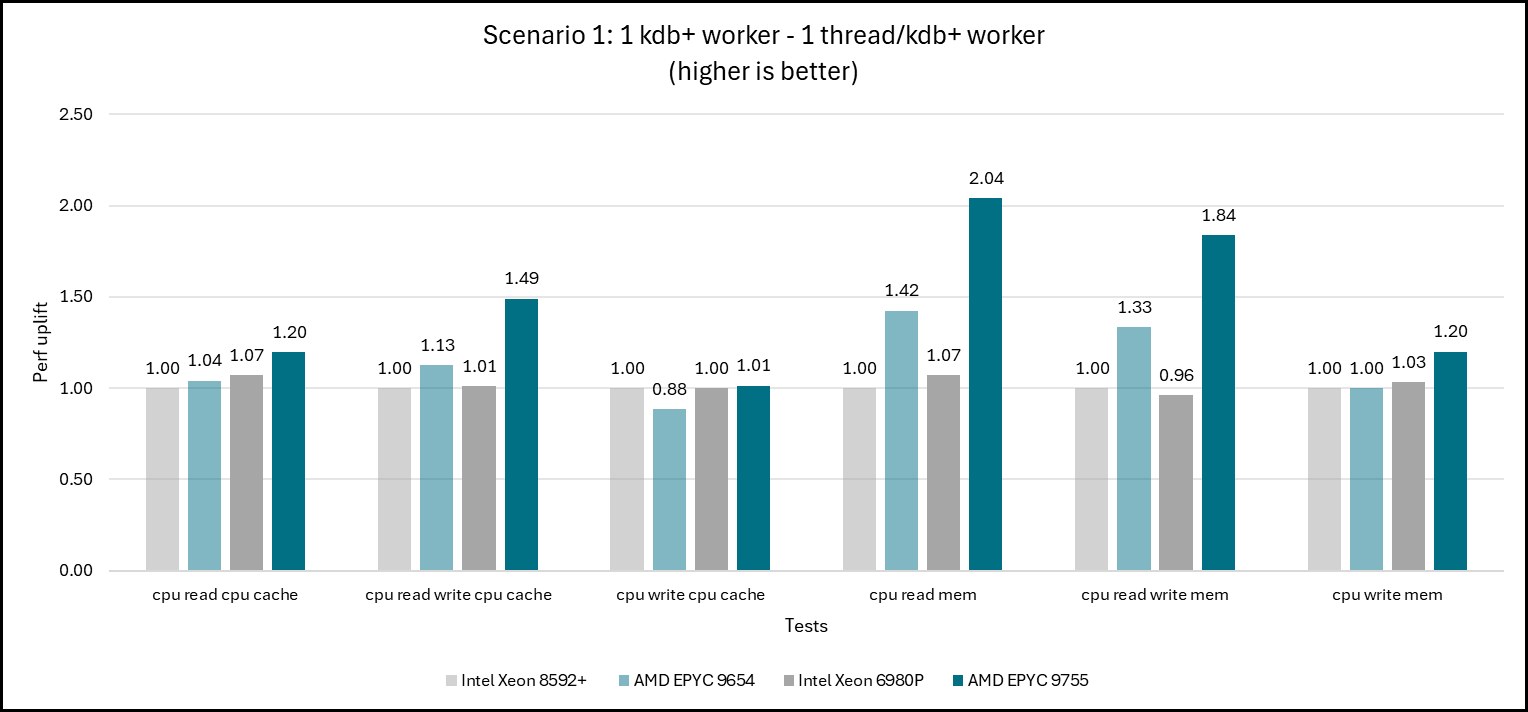
Figure 1: KX Nano – Scenario 1 results across Intel Xeon 8592+, Intel Xeon 6980P, AMD EPYC 9654, and AMD EPYC 9755 [1]. Results may vary.
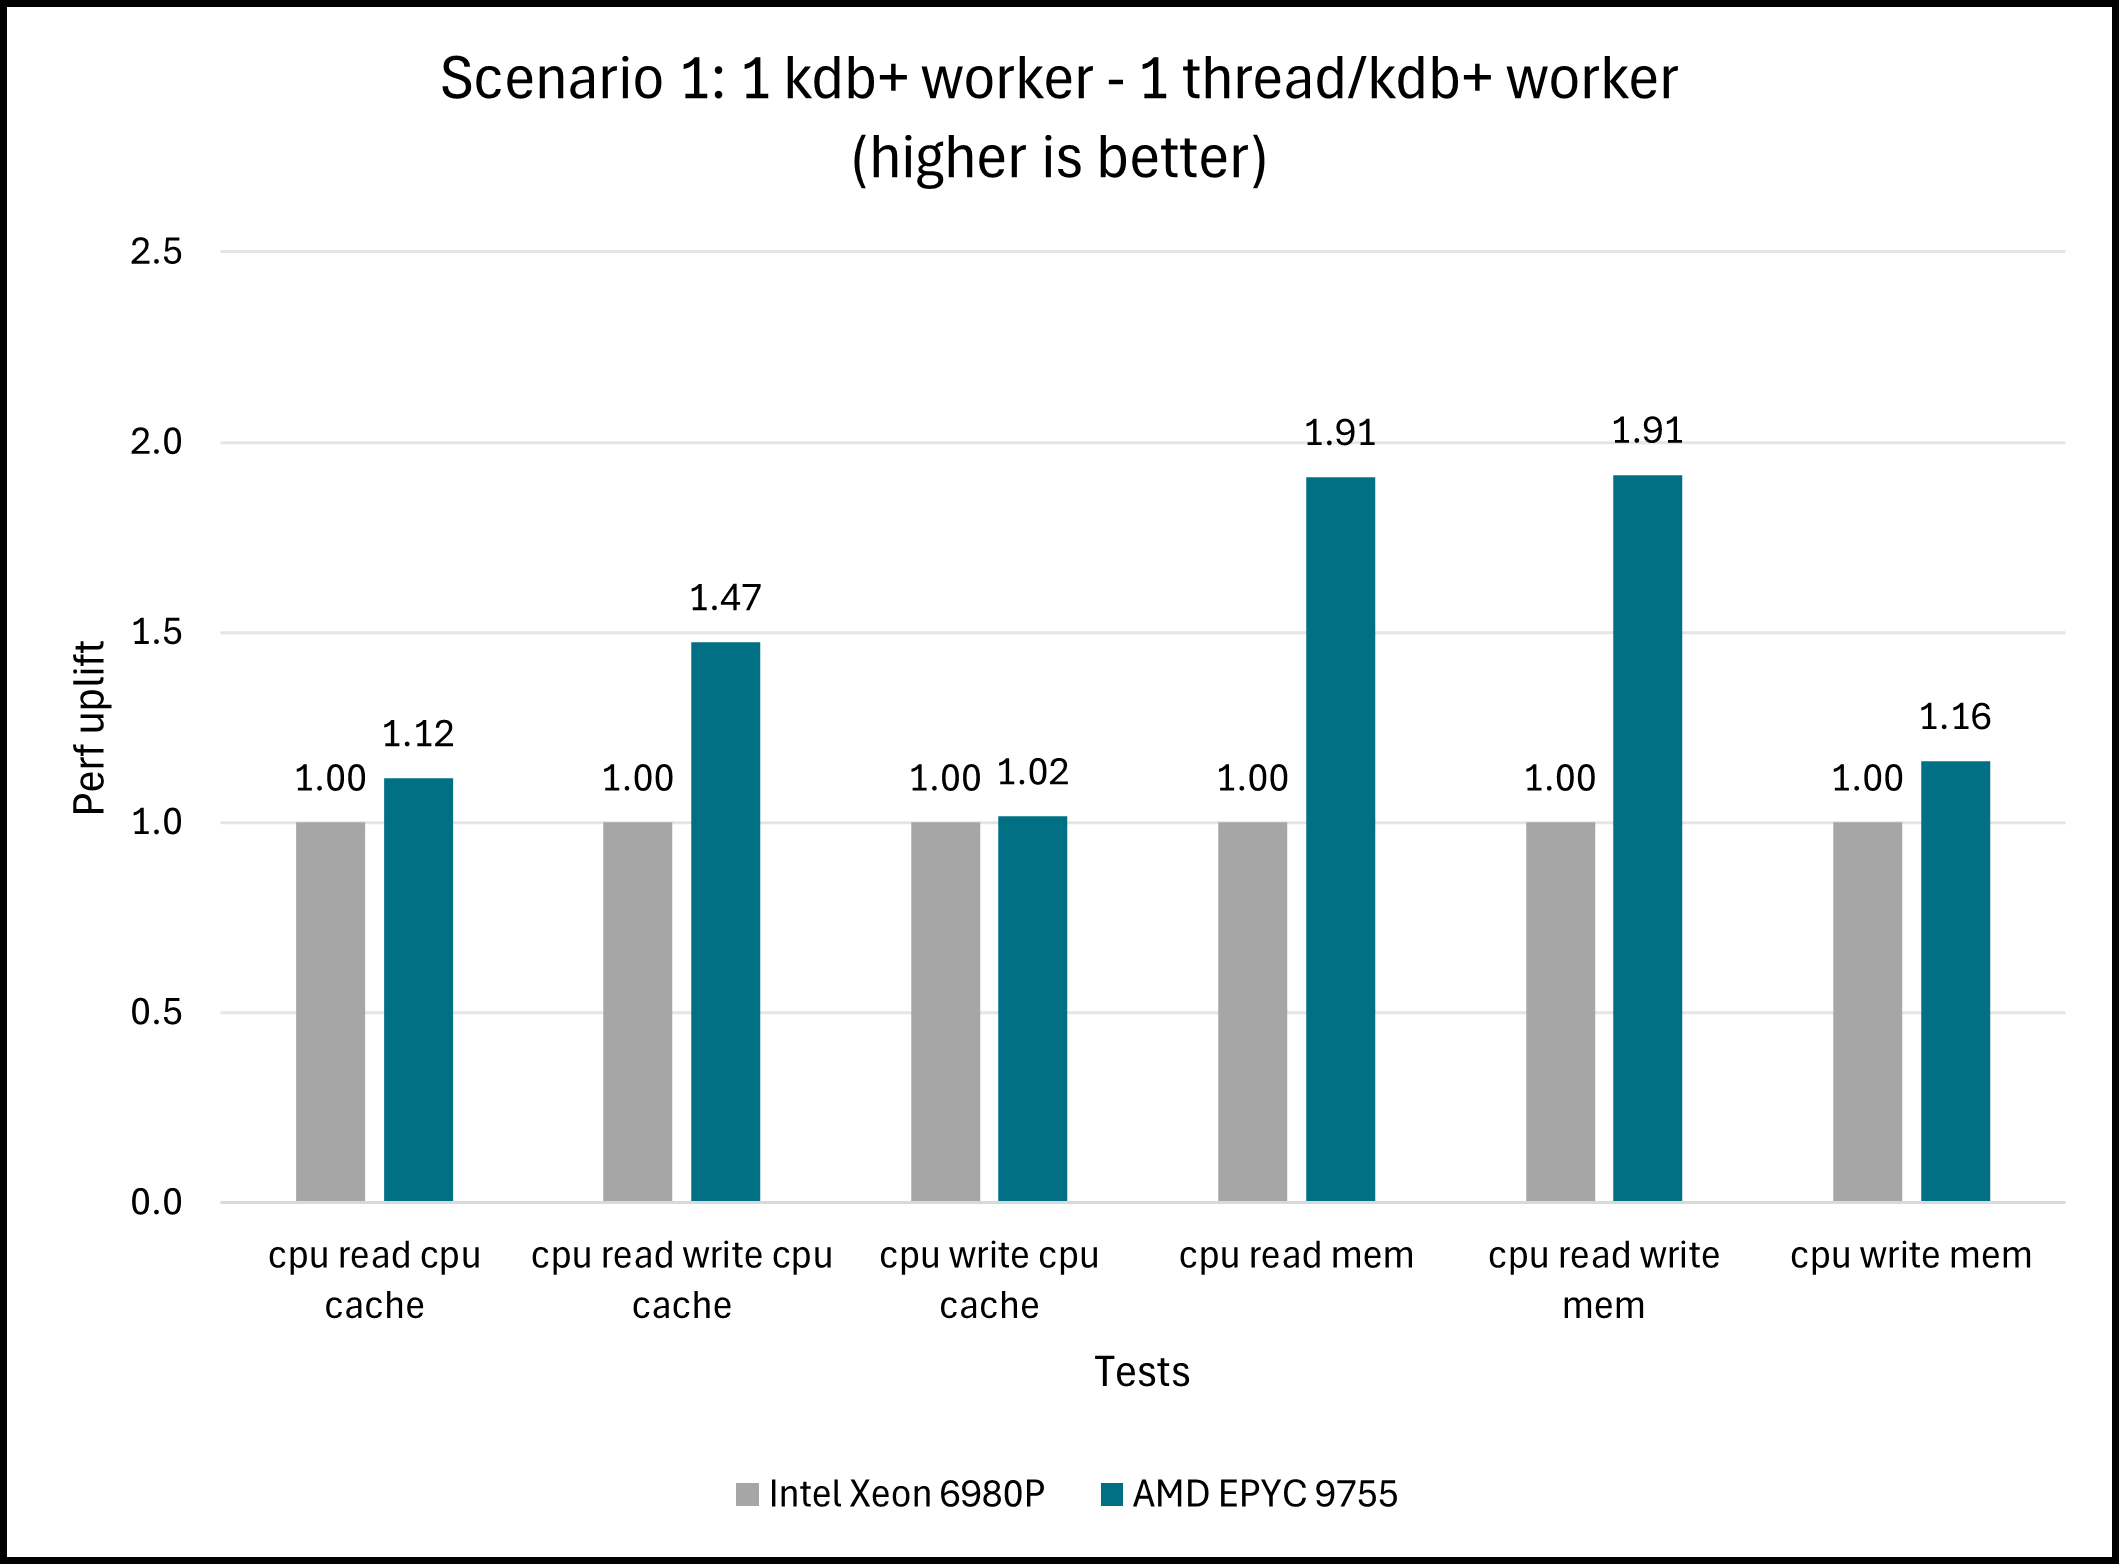
Figure 2: KX Nano – Scenario 1 comparisons between Intel Xeon 6980P and AMD EPYC 9755 [2]. Results may vary.
Scenario 1 observations:
- A single AMD EPYC 9755 thread executing a single kdb+ worker outperforms the same configuration with Intel Xeon 6980P across all tests. The most significant performance uplift of up to 1.91x is observed when running both the cpu read and cpu read write tests in the “Mem” test group.
- AMD EPYC 9654 continues to perform competitively vs. both Intel systems, achieving up to 1.42x the performance uplift vs. Intel Xeon 8592+ on the cpu read test in the “Mem” test group.
Compared to the single-threaded execution method of Scenario 1, the multi-threaded Scenarios of 2 and 3 are more representative of system-level deployments at typical FSI enterprises. These results are described next.
Scenario 2
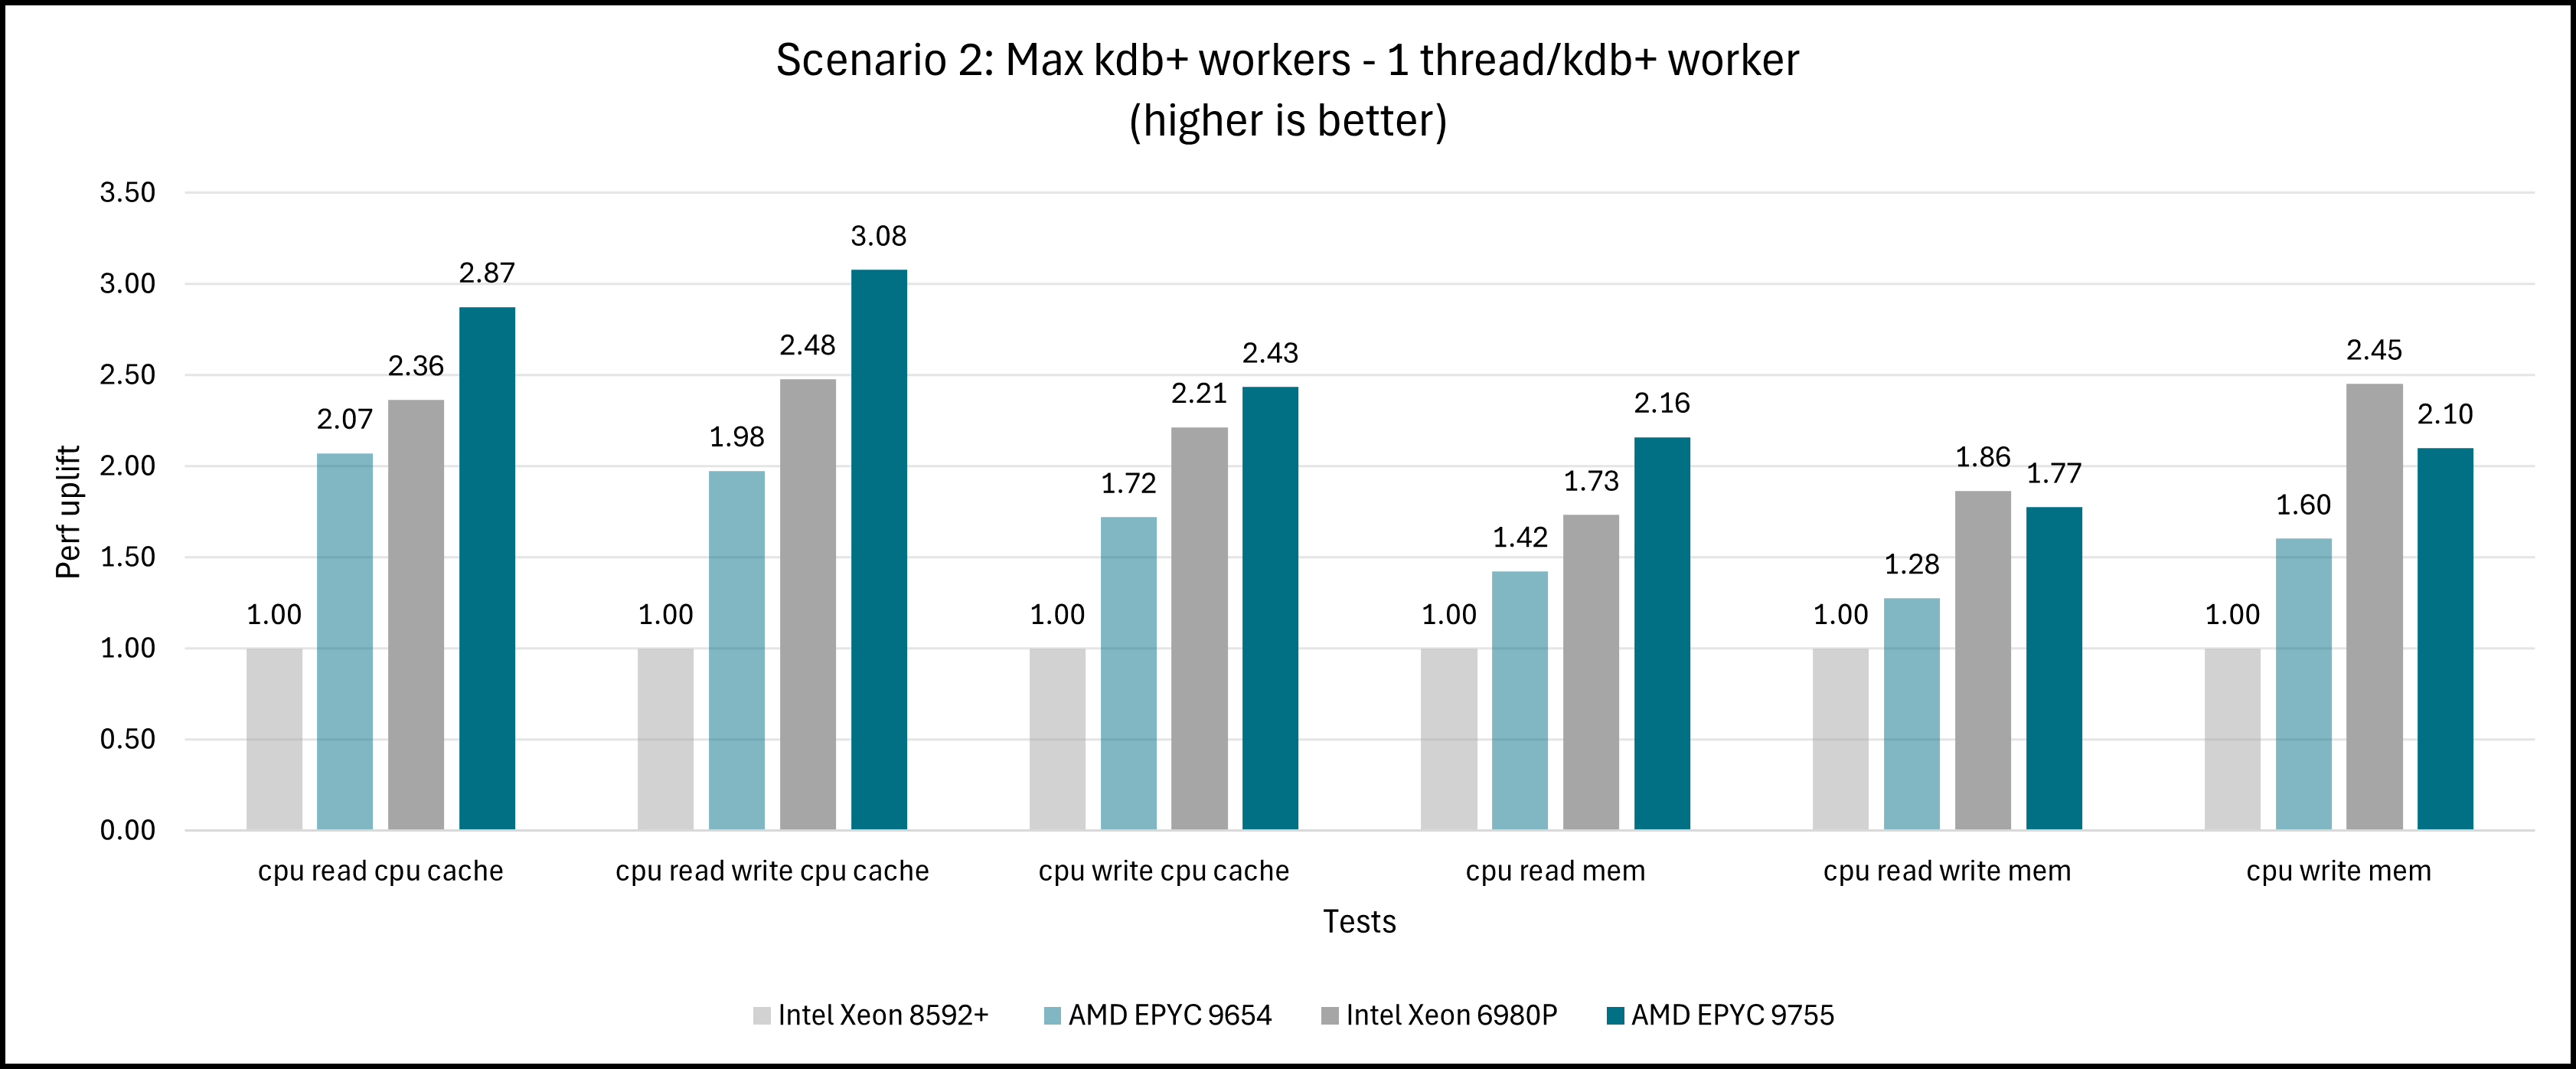
Figure 3: KX Nano – Scenario 2 results across Intel Xeon 8592+, Intel Xeon 6980P, AMD EPYC 9654, and AMD EPYC 9755 [1]. Results may vary.
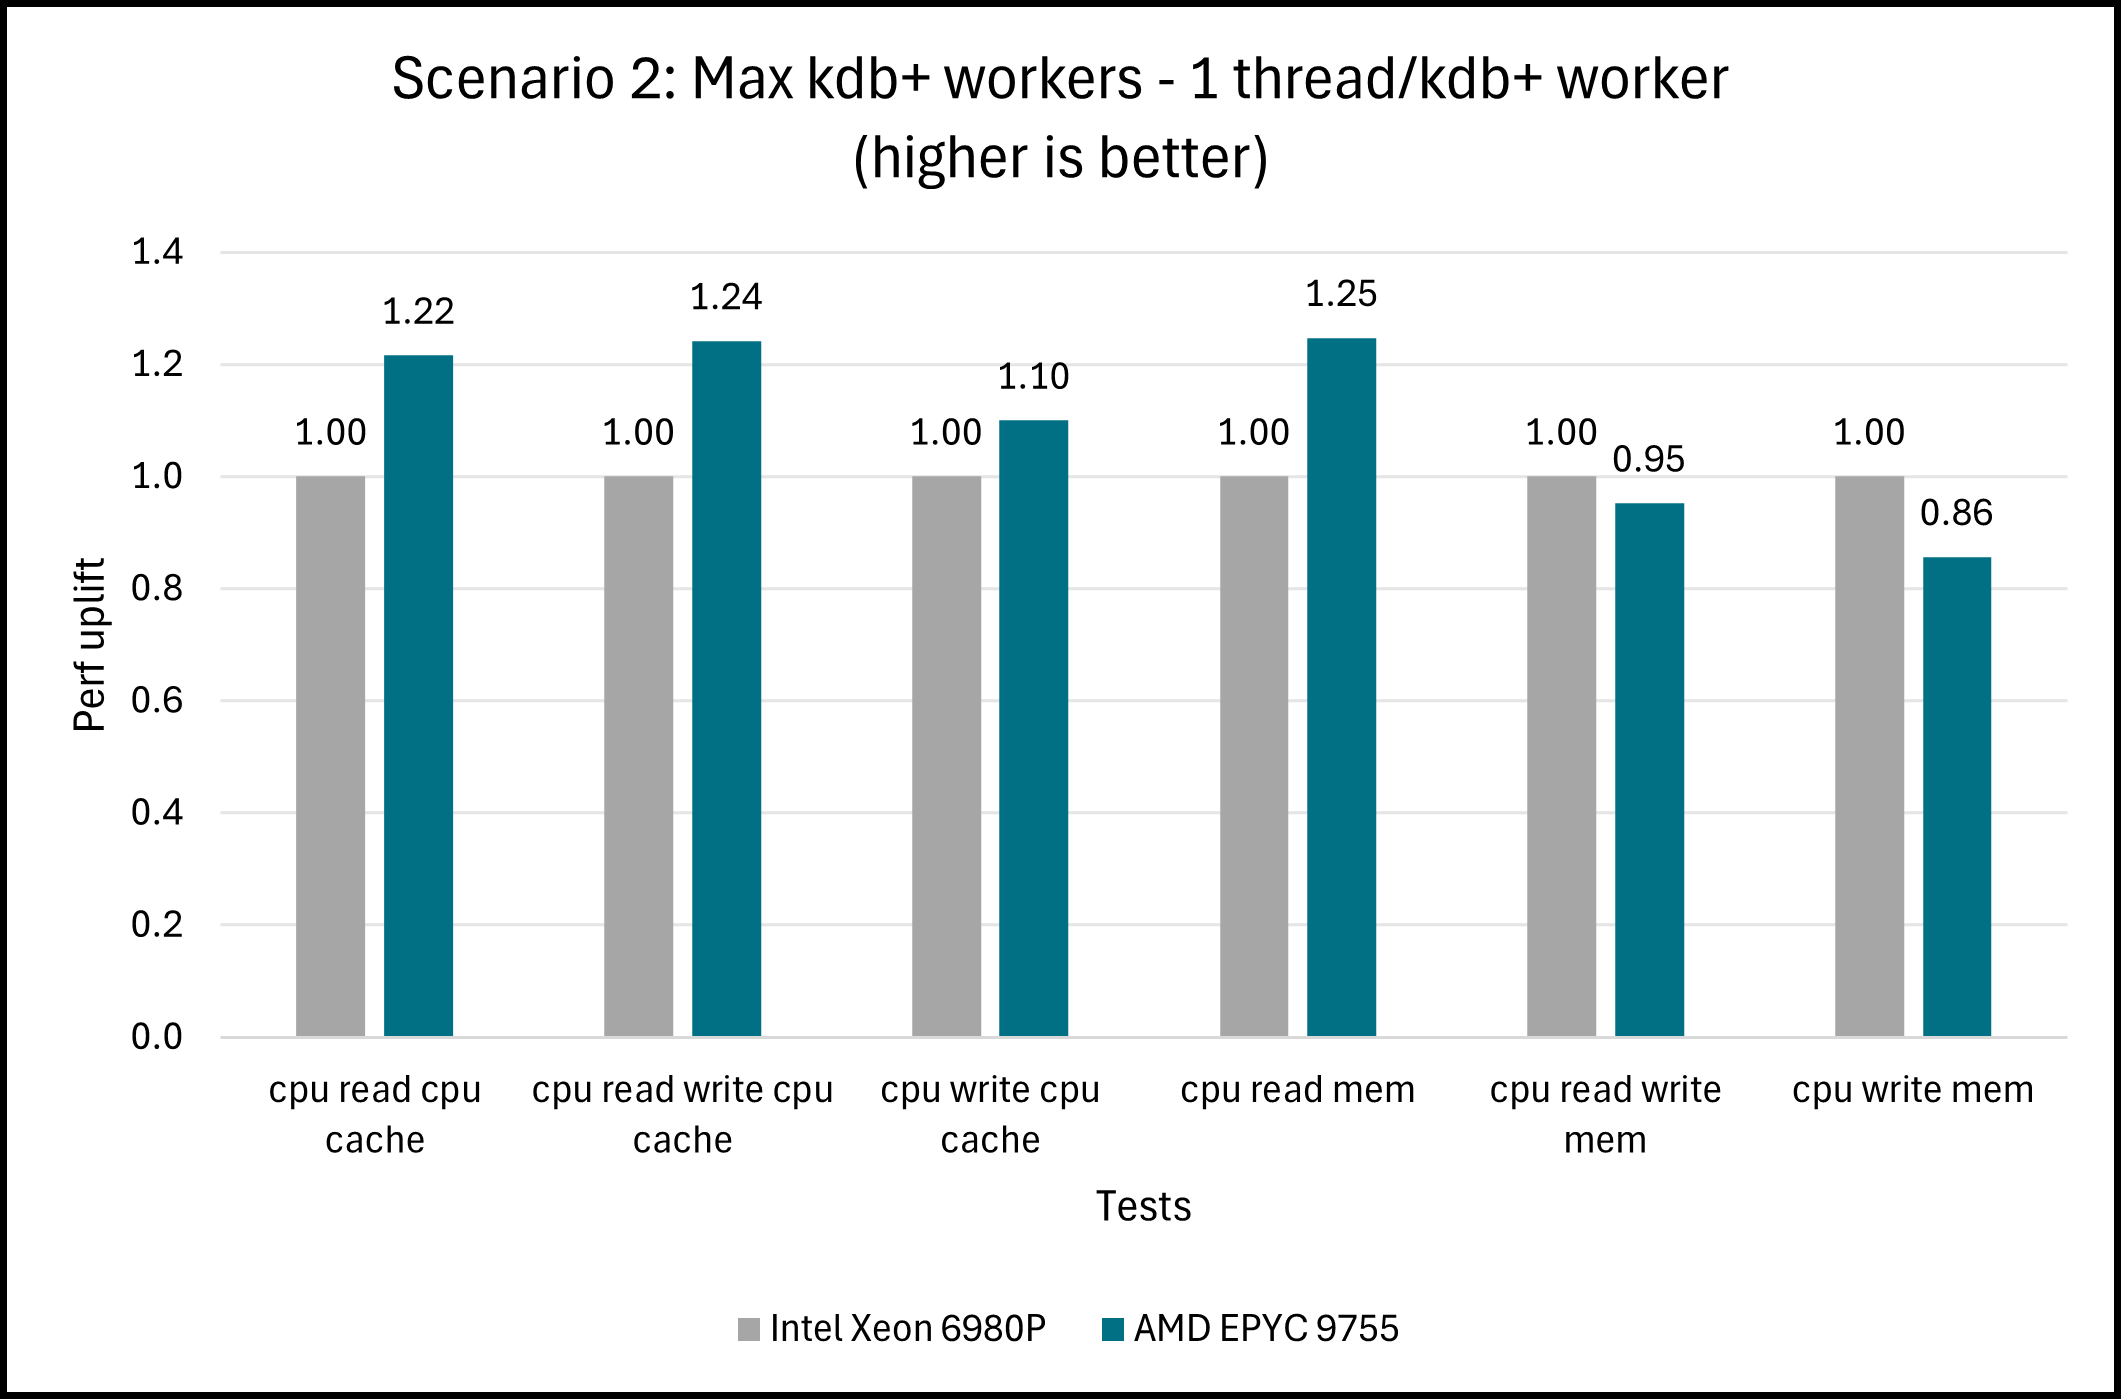
Figure 4: KX Nano – Scenario 2 comparisons between Intel Xeon 6980P and AMD EPYC 9755 [2]. Results may vary.
Scenario 2 thread/kdb+ worker allocations:
In the case of Scenario 2, one thread is allocated per kdb+ worker. Since SMT=off for all servers, the total number of threads is equal to the number of CPU cores across the 2P server, which is also equal to the number of kdb+ workers.
Server |
Core Count |
Total kdb+ Workers |
Intel Xeon 8592+ |
64 cores per CPU 128 cores per 2P system |
128 kdb+ workers |
AMD EPYC 9654 |
96 cores per CPU 192 cores per 2P system |
192 kdb+ workers |
Intel Xeon 6980P |
128 cores per CPU 256 cores per 2P system |
256 kdb+ workers |
AMD EPYC 9755 |
128 cores per CPU 256 cores per 2P system |
256 kdb+ workers |
Scenario 2 observations:
- A 2P AMD EPYC 9755 system executing a total of 256 kdb+ workers outperforms the same configuration with Intel Xeon 6980P with the same number of kdb+ workers by up to 1.25x in the cpu read test in the “Mem” test group.
- Generational improvements for both Intel and AMD are more evident in Scenario 2 than in Scenario 1, with both the later generations of 6th Gen Intel Xeon and 5th Gen AMD EPYC providing significantly better performance compared to their n-1 counterparts on KX Nano.
Scenario 3
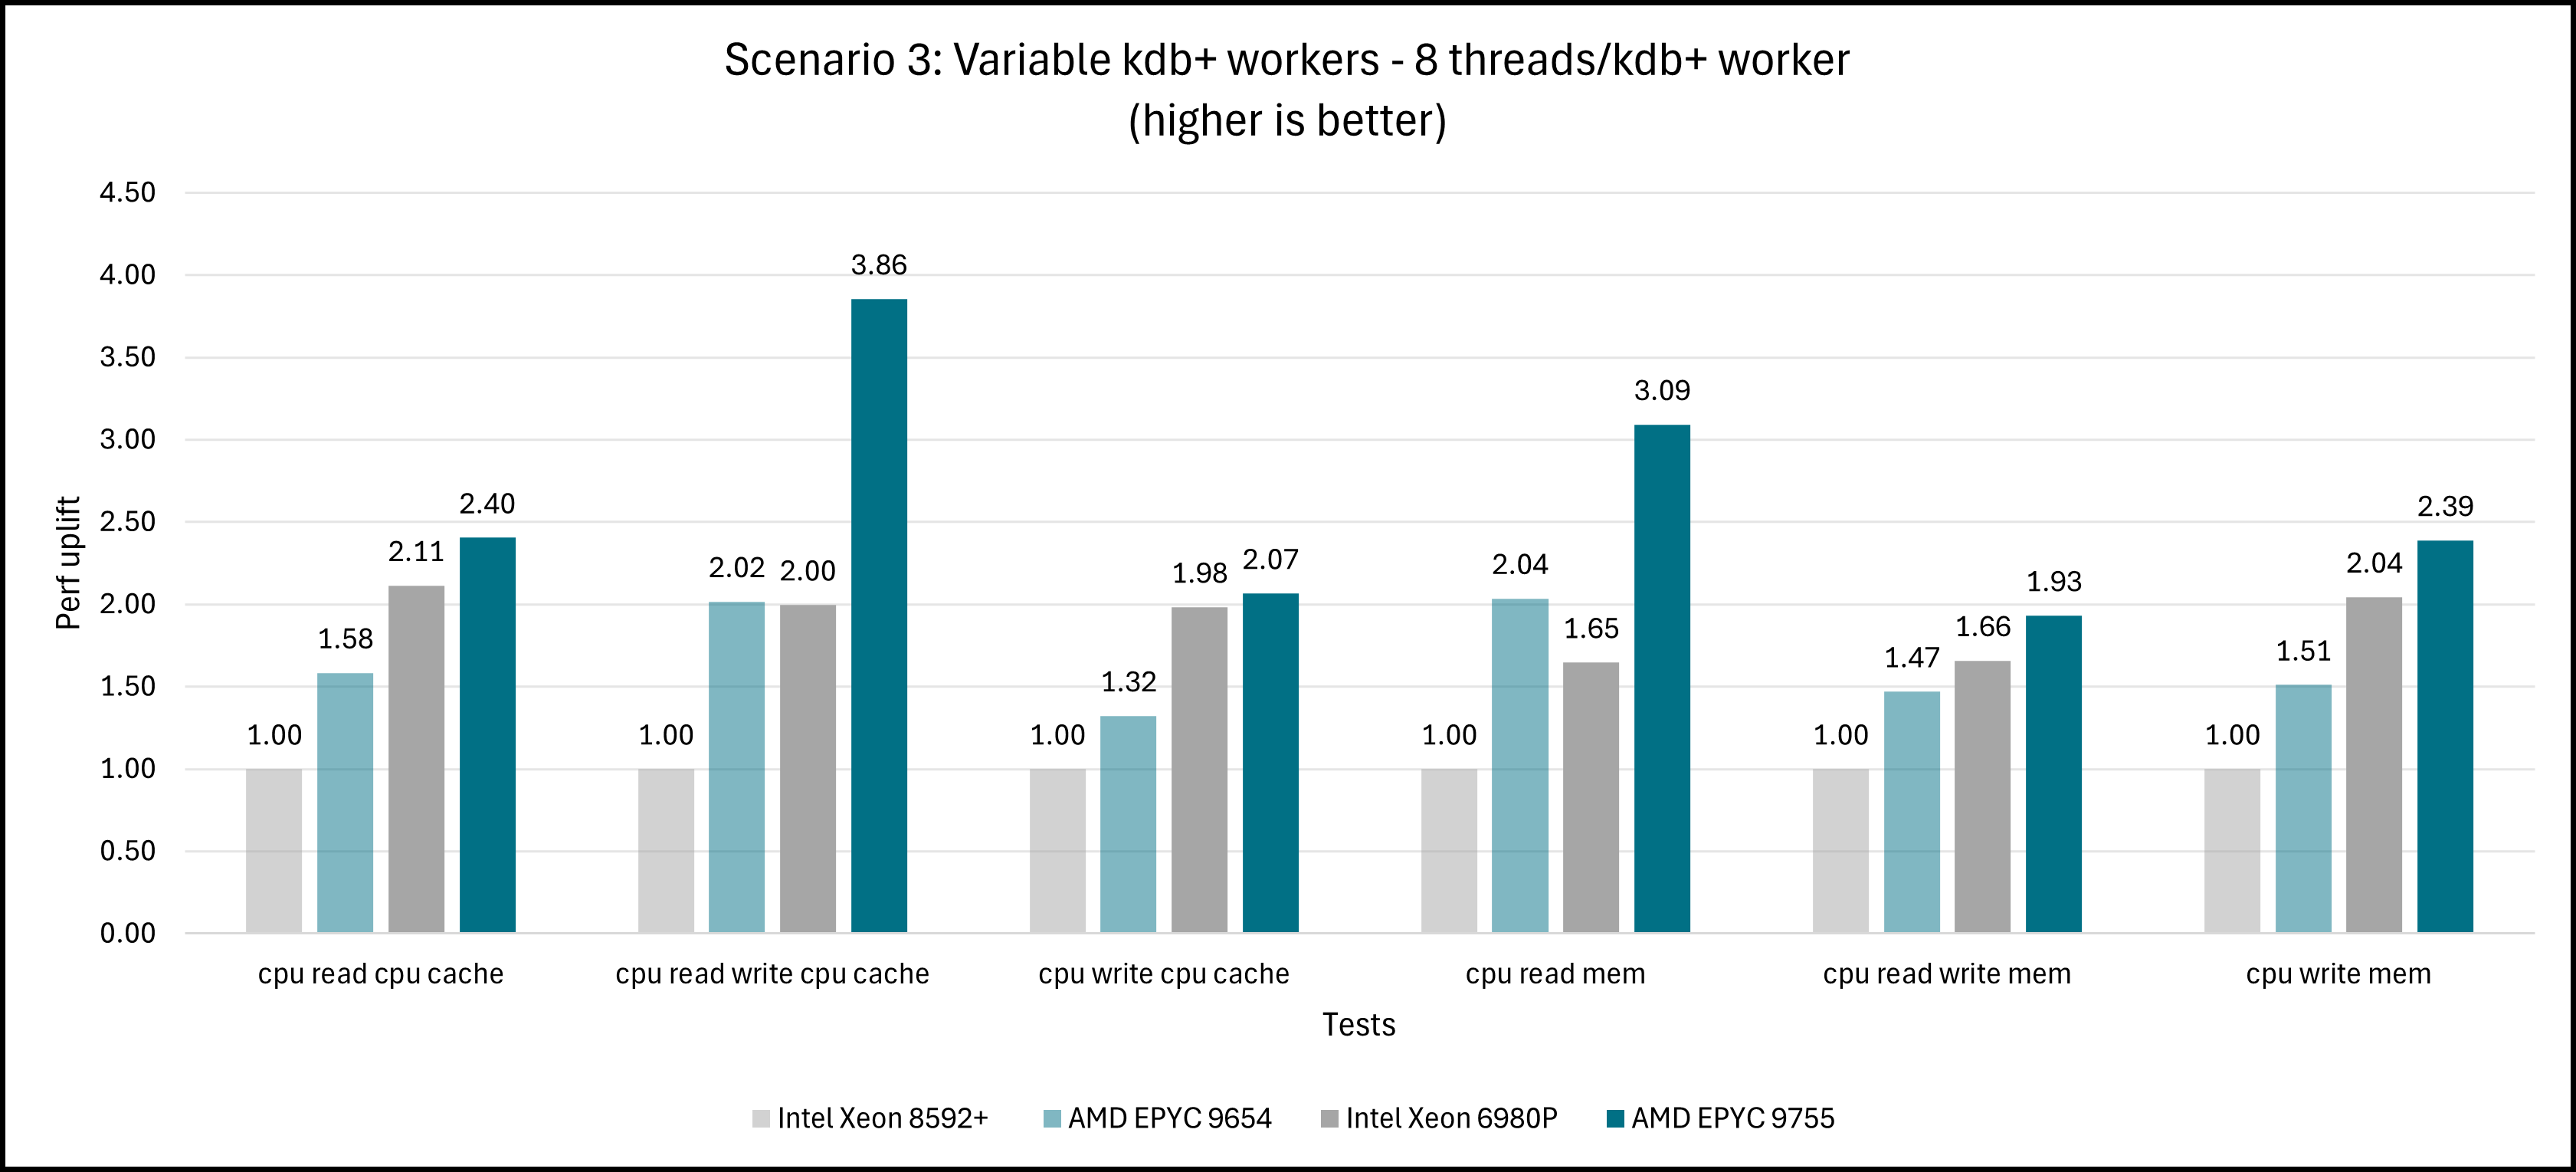
Figure 5: KX Nano – Scenario 3 results across Intel Xeon 8592+, Intel Xeon 6980P, AMD EPYC 9654, and AMD EPYC 9755 [1]. Results may vary.
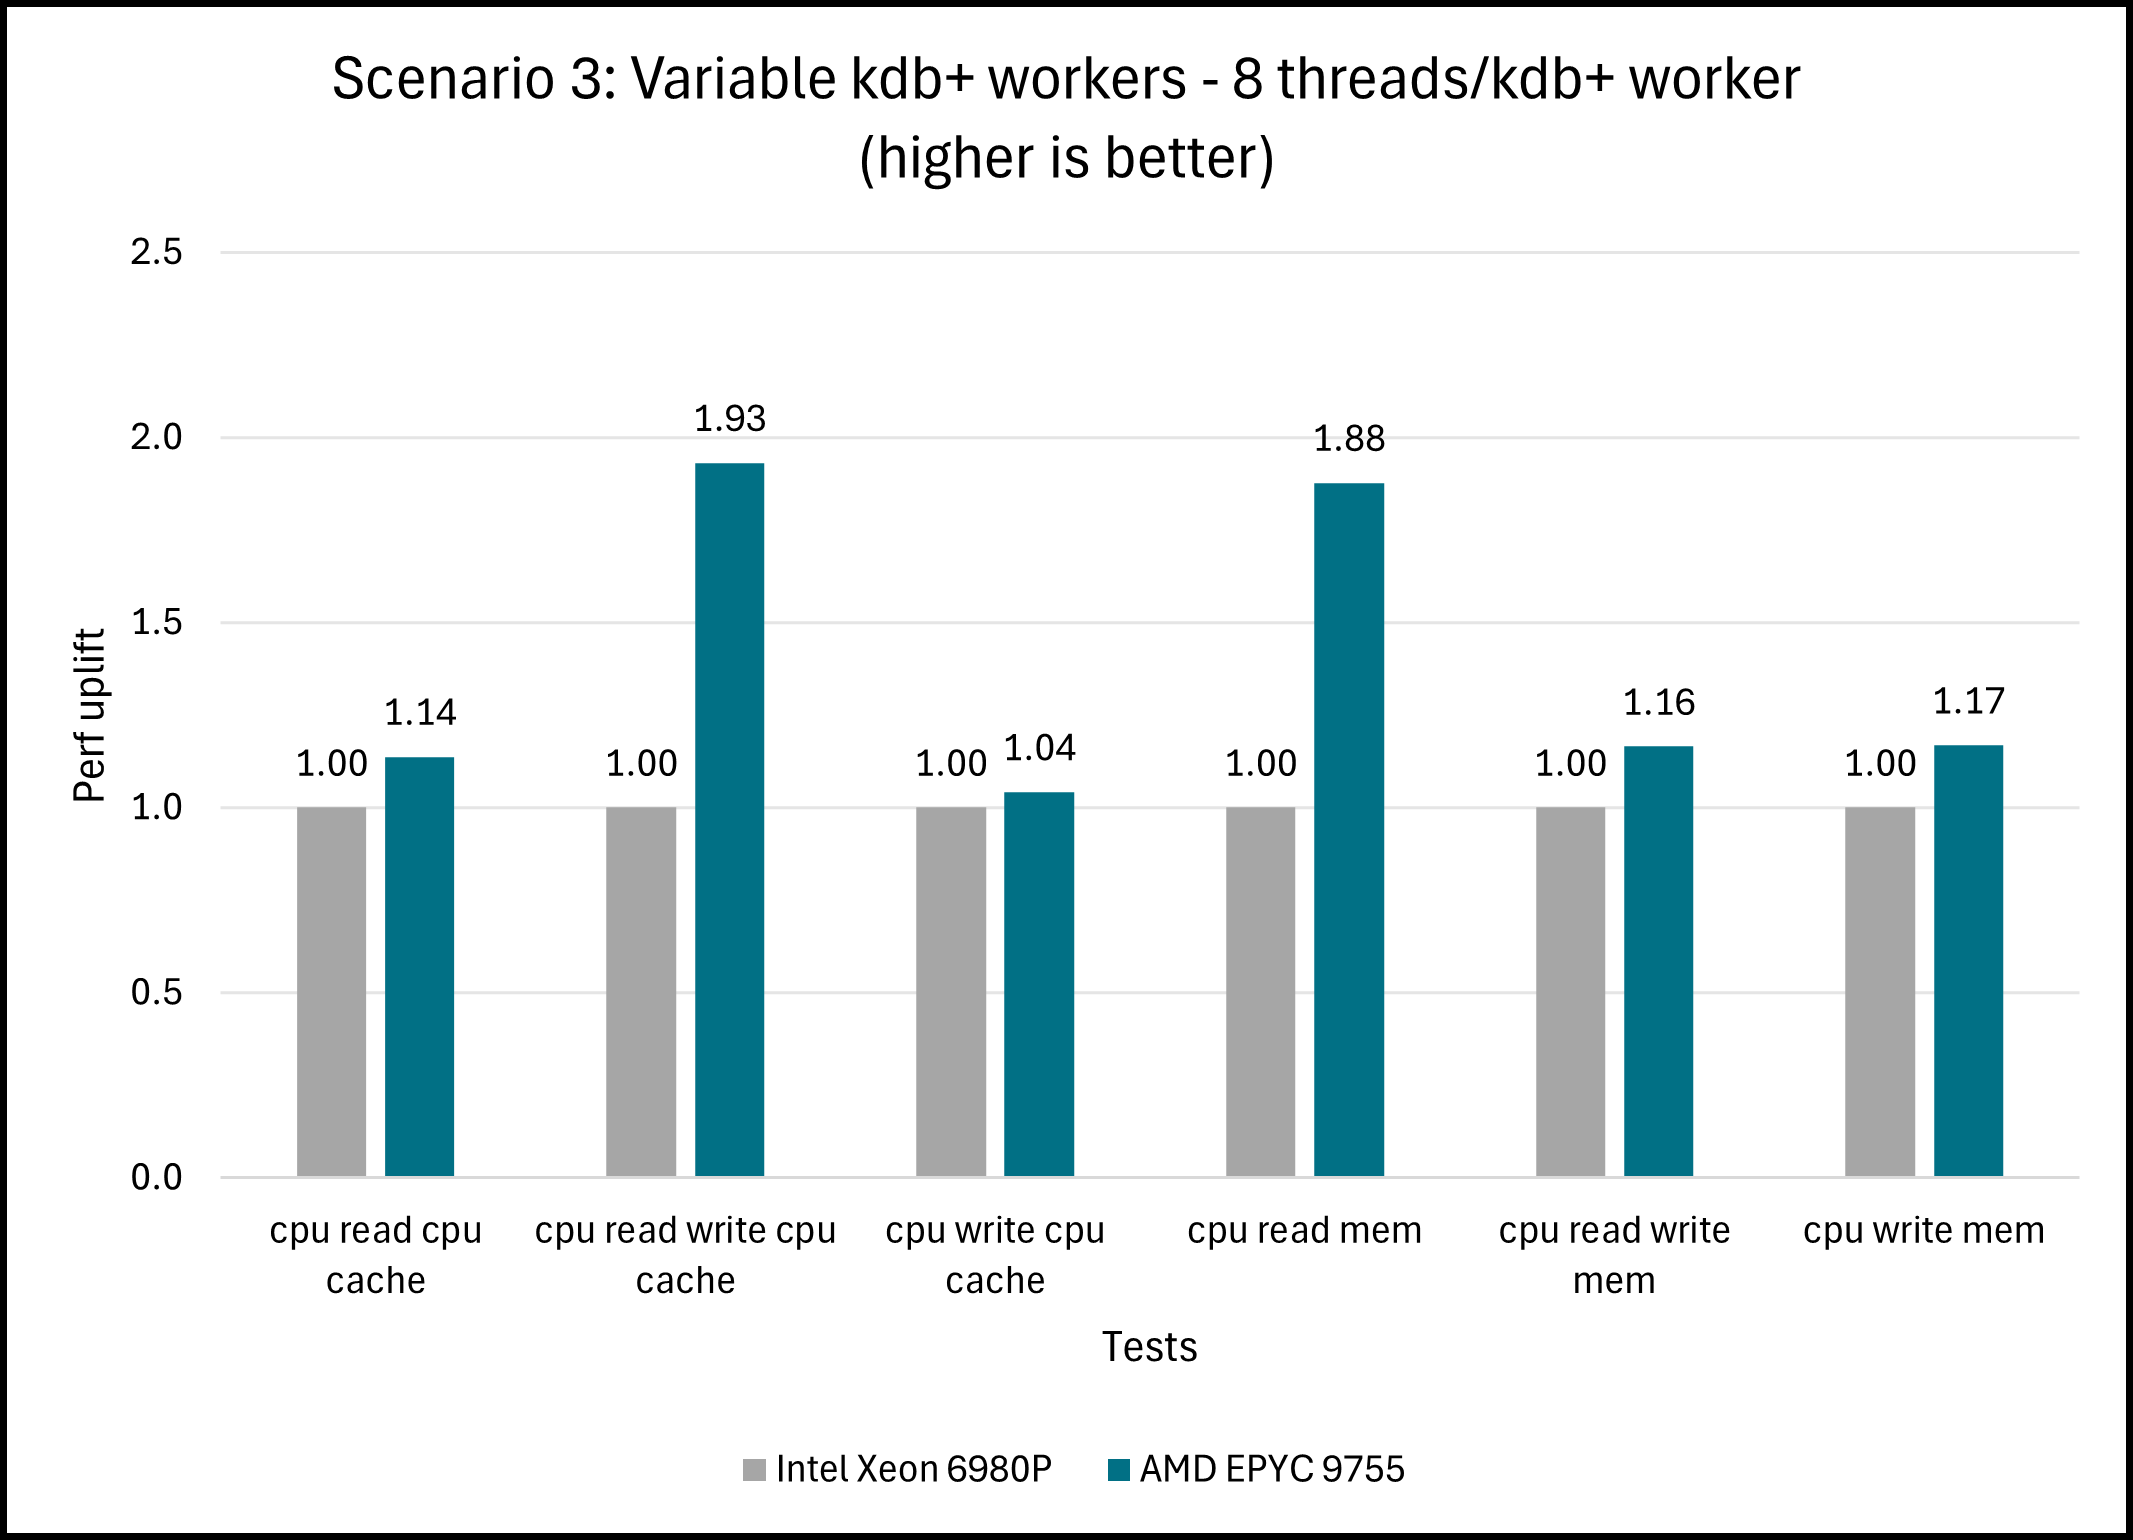
Figure 6: KX Nano – Scenario 3 comparisons between Intel Xeon 6980P and AMD EPYC 9755 [2]. Results may vary.
Scenario 3 thread/kdb+ worker allocations:
Scenario 3 allows for a variable number of threads allocated per kdb+ worker. The decision was made to opt for 8 threads per kdb+ worker across all systems for an apples-to-apples comparison. As such, the number of kdb+ workers is calculated by dividing the total system thread count by 8.
Server |
Core Count |
Total kdb+ Workers |
Intel Xeon 8592+ |
64 cores per CPU 128 cores per 2P system |
16 kdb+ workers |
AMD EPYC 9654 |
96 cores per CPU 192 cores per 2P system |
24 kdb+ workers |
Intel Xeon 6980P |
128 cores per CPU 256 cores per 2P system |
32 kdb+ workers |
AMD EPYC 9755 |
128 cores per CPU 256 cores per 2P system |
32 kdb+ workers |
Scenario 3 observations:
- A 2P AMD EPYC 9755 system executing a total of 32 kdb+ workers outperforms the same configuration with Intel Xeon 6980P with the same number of kdb+ workers by up to 1.93x in the cpu read write test in the “CPU cache” test group.
- Similar performance uplifts are observed in the “Mem” test group when comparing AMD EPYC 9755 vs. Intel Xeon 6980P, with up to 1.88x improvement observed in the CPU read test.
Systems Under Test
Intel Xeon 8592+ |
Intel Xeon 6980P |
4th Gen AMD EPYC 9654 |
5th Gen AMD EPYC 9755 |
|
Model |
Supermicro |
Supermicro |
AMD Customer Reference Board (“CRB”) Titanite |
AMD Customer Reference Board (“CRB”) Volcano |
Processor |
8592+ |
6980P |
9654 |
9755 |
Socket |
2 |
2 |
2 |
2 |
Cores |
64 |
128 |
96 |
128 |
Base Frequency/ Boost/Turbo Frequency |
1.9 GHz/3.9 GHz |
2 GHz/3.9 GHz |
2.4 GHz/3.7 GHz |
2.7 GHz/4.1 GHz |
L1d/L2/L3 |
6 MiB/256 MiB/640MiB |
6 MiB/512 MiB/1 GiB |
6 MiB/192 MiB/ 768 MiB |
12 MiB/ 256 MiB/ 1 GiB |
NUMA Nodes |
2 |
6 |
2 |
2 |
Memory |
1 TB |
1.5 TB |
1.5 TB |
2.3 TB |
Size |
64 GB |
64 GB |
64 GB |
96 GB |
Speed |
5600 MT/s |
6400 MT/s |
4800 MT/s |
6400 MT/s |
Memory channels |
16 |
24 |
24 |
24 |
OS |
RHEL 9.5 |
RHEL 9.5 |
RHEL 9.5 |
RHEL 9.5 |
Kernel |
5.14.0-503.15.1.el9_5.x86_64 |
5.14.0-503.11.1.el9_5.x86_64 |
5.14.0-503.11.1.el9_5.x86_64 |
5.14.0-503.40.1.el9_5.x86_64 |
SMT |
OFF |
OFF |
OFF |
OFF |
Power Performance Tuning (Intel)/Determinism (AMD) |
Default |
Default |
Power |
Power |
GCC Version |
11.5 |
11.5 |
11.2 |
11.2 |
Continuing to Benchmark with KX Nano
As the benchmarking data above shows, AMD EPYC processors are well-positioned to run kdb+, the time series database and real-time analytics solution from KX.
KX was helpful in providing guidance on how to best run their KX Nano benchmarking suite for AMD to collect the above results.
AMD looks forward to continuing to benchmark and publish with KX Nano for the benefit of the FSI community.
Benchmarking conducted by Nimisha Raut, Senior Member of Technical Staff (SMTS) on the Datacenter Ecosystem and Applications Engineering (DEAE) team at AMD.
References
- https://kx.com/blog/kdb-features-in-dell-stac-m3-benchmark-tests/
- https://infohub.delltechnologies.com/nl-nl/t/algorithmic-trading-scaling-concurrency-and-performance-with-dell-powerscale/
- https://stacresearch.com/news/KDB220506
- https://kx.com/blog/supercharge-hardware-evaluation-with-kx-nano/
Endnotes
[1] 9xx5-223A: Testing as of 9/16/2025 using the open-source KX Systems Nano benchmarking suite, version 6.2.1, retrieved here: https://github.com/KxSystems/nano
Testing measured KX Systems Nano “CPU” benchmarks on AMD EPYC™ 9755 and 9654 processors, as well as Intel Xeon® Platinum 8592+ and Intel Xeon® Platinum 6980P processors all with multi-threading off (1 core = 1 thread). The metric was throughput, measured in MB/s (higher is better). Results may vary based on factors including but not limited to BIOS and OS settings and versions, software versions, and workload configurations.
System configurations:
AMD EPYC 9755
- AMD “Volcano” CRB Platform
- 2P, 128 cores per socket, 24 memory channels
- 2 NUMA nodes
- 2.3TB Memory using 96GB DDR5 DIMMs with 6400 MT/s speeds
- OS version: RHEL 9.5
- Kernel: 5.14.0-503.40.1.el9_5.x86_64
- GCC version: 11.2
- SMT: off
- Determinism: power
- All other settings default
AMD EPYC 9654
- AMD “Titanite” CRB Platform
- 2P, 96 cores per socket, 24 memory channels
- 2 NUMA nodes
- 1.5TB Memory using 64GB DDR5 DIMMs with 4800 MT/s speeds
- OS version: RHEL 9.5
- Kernel: 5.14.0-503.11.1.el9_5.x86_64
- GCC version: 11.2
- SMT: off
- Determinism: power
- All other settings default
Intel Xeon 6980P:
- Supermicro platform
- 2P, 128 cores per socket, 16 memory channels
- 6 NUMA nodes
- 1.5 TB Memory using 64GB DDR5 DIMMs with 6400 MT/s speeds
- OS version: RHEL 9.5
- Kernel: 5.14.0-503.11.1.el9_5.x86_64
- GCC version: 11.5
- SMT: off
- Power Performance Tuning profile: default
- All other settings default
Intel Xeon 8592+:
- Supermicro platform
- 2P, 64 cores per socket, 16 memory channels
- 2 NUMA nodes
- 1TB Memory using 64GB DDR5 DIMMs with 5600 MT/s speeds
- OS version: RHEL 9.5
- Kernel: 5.14.0-503.15.1.el9_5.x86_64
- GCC version: 11.5
- SMT: off
- Power Performance Tuning profile: default
- All other settings default
Nano “CPU” benchmarking covers three scenarios:
1. 1 kdb worker
2. Max kdb workers (1 thread/kdb worker)
3. Variable kdb workers (8 threads/kdb workers)
Each scenario contains two test groups:
1. CPU cache – tests L1 and L2 cache
2. Mem – tests L3 cache and main memory
There are three tests within each test group:
1. CPU read mem
2. CPU read write mem
3. CPU write mem
Scenario 1
1 thread - 1 kdb worker
Intel Xeon 8592+ ("Emerald Rapids") Baseline
AMD EPYC 9654 ("Genoa") relative improvement vs. Intel Xeon 8592+ ("Emerald Rapids")
Intel Xeon 6980P ("Granite Rapids") relative improvement vs. Intel Xeon 8592+ ("Emerald Rapids")
AMD EPYC 9755 ("Turin") relative improvement vs. Intel Xeon 8592+ ("Emerald Rapids")
“CPU cache” test group:
cpu read cpu cache 1.00 1.04 1.07 1.20
cpu read write cpu cache 1.00 1.13 1.01 1.49
cpu write cpu cache 1.00 0.88 1.00 1.01
“Mem” test group:
cpu read mem 1.00 1.42 1.07 2.04
cpu read write mem 1.00 1.33 0.96 1.84
cpu write mem 1.00 1.00 1.03 1.20
Scenario 2
1 thread - Max kdb worker
Intel Xeon 8592+ ("Emerald Rapids") Baseline
AMD EPYC 9654 ("Genoa") relative improvement vs. Intel Xeon 8592+ ("Emerald Rapids")
Intel Xeon 6980P ("Granite Rapids") relative improvement vs. Intel Xeon 8592+ ("Emerald Rapids")
AMD EPYC 9755 ("Turin") relative improvement vs. Intel Xeon 8592+ ("Emerald Rapids")
“CPU cache” test group:
cpu read cpu cache 1.00 2.07 2.36 2.87
cpu read write cpu cache 1.00 1.98 2.48 3.08
cpu write cpu cache 1.00 1.72 2.21 2.43
“Mem” test group:
cpu read mem 1.00 1.42 1.73 2.16
cpu read write mem 1.00 1.28 1.86 1.77
cpu write mem 1.00 1.60 2.45 2.10
Scenario 3
8 thread - N kdb worker
Intel Xeon 8592+ ("Emerald Rapids") Baseline
AMD EPYC 9654 ("Genoa") relative improvement vs. Intel Xeon 8592+ ("Emerald Rapids")
Intel Xeon 6980P ("Granite Rapids") relative improvement vs. Intel Xeon 8592+ ("Emerald Rapids")
AMD EPYC 9755 ("Turin") relative improvement vs. Intel Xeon 8592+ ("Emerald Rapids")
“CPU cache” test group:
cpu read cpu cache 1.00 1.58 2.11 2.40
cpu read write cpu cache 1.00 2.02 2.00 3.86
cpu write cpu cache 1.00 1.32 1.98 2.07
“Mem” test group:
cpu read mem 1.00 2.04 1.65 3.09
cpu read write mem 1.00 1.47 1.66 1.93
cpu write mem 1.00 1.51 2.04 2.39
[2] 9xx5-224: Testing as of 7/17/2025 using the open-source KX Systems Nano benchmarking suite, version 6.2.1, retrieved here: https://github.com/KxSystems/nano
Testing measured KX Systems Nano “CPU” benchmarks on AMD EPYC™ 9755 processors as well as Intel Xeon® Platinum 6980P processors all with multi-threading off (1 core = 1 thread). The metric was throughput, measured in MB/s (higher is better).
System configurations:
AMD EPYC 9755
- AMD “Volcano” CRB Platform
- 2P, 128 cores per socket, 24 memory channels
- 2 NUMA nodes
- 2.3TB Memory using 96GB DDR5 DIMMs with 6400 MT/s speeds
- OS version: RHEL 9.5
- Kernel: 5.14.0-503.40.1.el9_5.x86_64
- GCC version: 11.2
- SMT: off
- Determinism: power
- All other settings default
Intel Xeon 6980P:
- Supermicro platform
- 2P, 128 cores per socket, 16 memory channels
- 6 NUMA nodes
- 1TB Memory using 64GB DDR5 DIMMs with 6400 MT/s speeds
- OS version: RHEL 9.5
- Kernel: 5.14.0-503.11.1.el9_5.x86_64
- GCC version: 11.5
- SMT: off
- Power Performance Tuning profile: default
- All other settings default
Nano “CPU” benchmarking covers three scenarios:
1. 1 kdb+ worker
2. Max kdb+ workers (1 thread/kdb+ worker)
3. Variable kdb+ workers (8 threads/kdb+ workers)
Each scenario contains two test groups:
1. CPU cache – tests L1 and L2 cache
2. Mem – tests L3 cache and main memory
There are three tests within each test group:
1. CPU read mem
2. CPU read write mem
3. CPU write mem
Scenario 1
1 thread - 1 kdb+ worker
Intel Xeon 6980P Baseline
AMD EPYC 9755 relative improvement vs. Intel Xeon 6980P
cpu read cpu cache 1.00 1.12
cpu read write cpu cache 1.00 1.47
cpu write cpu cache 1.00 1.02
cpu read mem 1.00 1.91
cpu read write mem 1.00 1.91
cpu write mem 1.0 1.16
Scenario 2
1 thread - Max kdb+ workers
Intel Xeon 6980P Baseline
AMD EPYC 9755 relative improvement vs. Intel Xeon 6980P
cpu read cpu cache 1.00 1.22
cpu read write cpu cache 1.00 1.24
cpu write cpu cache 1.00 1.10
cpu read mem 1.00 1.25
cpu read write mem 1.00 0.95
cpu write mem 1.00 0.86
Scenario 3
8 thread - N kdb+ workers
Intel Xeon 6980P Baseline
AMD EPYC 9755 relative improvement vs. Intel Xeon 6980P
cpu read cpu cache 1.00 1.14
cpu read write cpu cache 1.00 1.93
cpu write cpu cache 1.00 1.04
cpu read mem 1.00 1.88
cpu read write mem 1.00 1.16
cpu write mem 1.00 1.17

Related Blogs
-
A Practical Guide to Running LLMs on AMD Radeon™ GPUs — ROCm Blogs
This guide describes how to run LLMs on AMD Radeon™ GPUs using a range of partner frameworks, tools, and runtimes, with step-by-step setup instructions and performance optimization tips.
June 18, 2026
-
AI Across Industries: How AMD Technologies Are Powering the Next Wave of Enterprise Transformation
AI is reshaping every industry. Explore how leading enterprises are using AMD-powered AI infrastructure to accelerate innovation, improve efficiency, and drive business transformation.
June 18, 2026
-
AMD Spartan™ UltraScale+™ SU200P FPGA Now in Production
Now in production. AMD Spartan™ UltraScale+™ SU200P FPGA with high I/O, low power, and state-of-the-art security features.
June 15, 2026
-
Productionizing TurboQuant on AMD GPUs for KV-Cache-Bound LLM Inference — ROCm Blogs
Productionized TurboQuant 4-bit KV-cache quantization on AMD GPUs via vLLM, with custom kernels and accuracy analysis on agentic workloads.
June 10, 2026
-
AMD and Hack Club Launch Stardance
AMD teams with Hack Club, NASA, and GitHub Education for Stardance Challenge, a nationwide summer engineering competition for students to build real-world projects.
June 01, 2026
-
AMD Computex 2026: 10 Years of AM4, AM5 Support Through 2029 and Expanded RDNA 4 Gaming
AMD celebrates 10 years of AM4, extends AM5 through 2029 and expands RDNA 4 gaming with new Ryzen and Radeon launches.
May 31, 2026
-
Rethinking Retail Edge Infrastructure: Why Efficiency and Scalability Matters
Retail edge infrastructure powered by AMD EPYC 4005 CPUs and Supermicro systems delivers efficiency, scalability, and performance for modern retail environments, supporting diverse workloads and future needs.
May 27, 2026
-
ACE Studio Builds AI Music on DigitalOcean and AMD GPUs
Learn how ACE Studio powers AI music creation with DigitalOcean Gradient AI and AMD Instinct GPUs.
May 26, 2026