Advancing Low Latency CPU Inference on AMD EPYC™ Processors:
Nov 06, 2026

Optimizing BERT-Base with ZenDNN and zentorch
Encoder models such as BERT-Base remain the workhorse of latency-sensitive online inference — search ranking, semantic retrieval, classification, and reranking in RAG pipelines — where batch sizes are small, tail latency is critical, and CPUs are the most cost-effective target. Motivated by the goal of delivering best-in-class CPU inference on AMD EPYC™ processors, we set out to close the performance gap we observed between zentorch and ONNX Runtime for BERT-Base on AMD EPYC™ 9004 Series. This blog describes the optimizations that closed that gap and ultimately delivered substantial gains over ONNX Runtime.
We're pleased to share four targeted optimizations in our ZenDNN library and the zentorch plugin that not only close that gap but reverse it —delivering up to ~30% peak and ~9.7% (bare metal) average end-to-end gain over ONNX Runtime for FP321 and ~47.3% (bare metal) avg gain for BF162 across the configuration matrix, while preserving full numerical accuracy. The work spans graph-level fusion in the attention block (QKV Matmul projection fusion), cache-aware attention kernels, a low-overhead MatMul path, and CCD-aware inference placement on multi-chiplet AMD EPYC™ processors.
Deeper Performance Optimizations
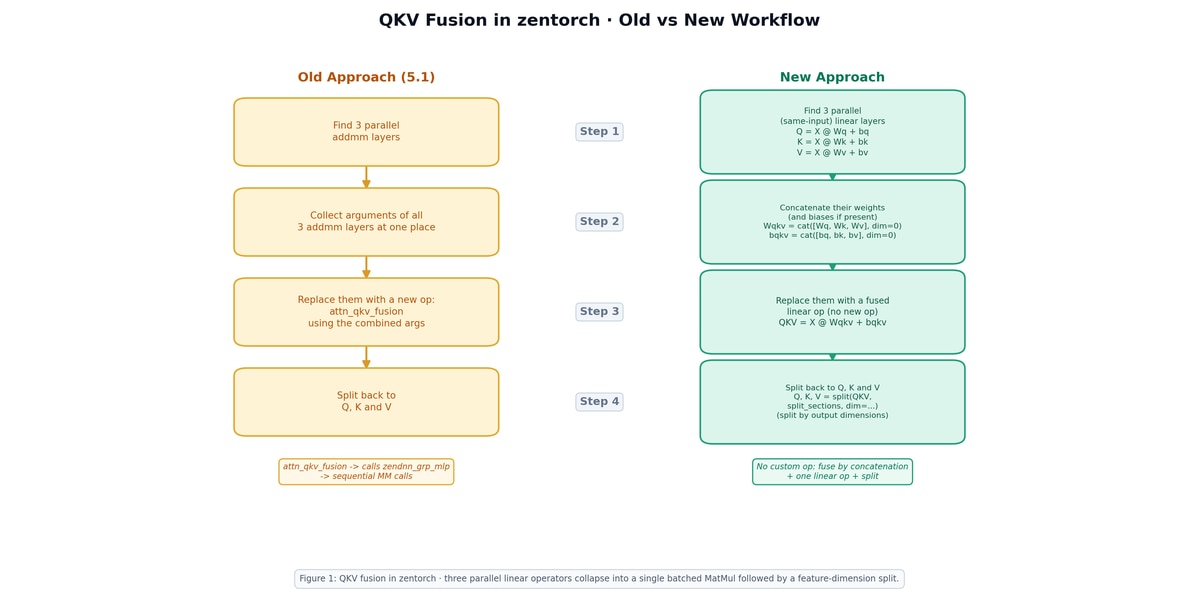
Fused QKV Projection in zentorch. The three parallel Query, Key, and Value linear projections in each attention block are rewritten as a single GEMM: their weight (and bias) tensors are concatenated, one larger GEMM is executed, and the output is split along the feature dimension. At batch size one, where each GEMM is small, this substantially improves hardware utilization. While working on this fusion, we identified that Inductor’s fusion pass fails to propagate storage offsets correctly, leading to accuracy issues. The PyTorch issue (#175325) has been reproduced by the PyTorch team and a fix is added by them.
Cache-Aware Q/KV Sequence Tiling in SDPA: The SDPA path in the re-architected ZenDNN library now tiles Query and Key/Value along the sequence dimension with block sizes tuned to the Zen cache hierarchy on AMD EPYC™ processors, keeping the inner-loop working set resident across the typical sequence lengths (32 -128) used in online workloads.
ZenDNN Low-Overhead MatMul (Low Overhead API LowOHA): The attention inner loop performs many small MatMuls back-to-back, where conventional primitive-creation cost becomes a measurable fraction of execution time. A new LowOHA bypasses that cost, and combined with AMD-optimized AOCL-DLP kernels for the underlying GEMMs delivers material gains at the small matrix shapes that dominate batch-size-one inference.
CCD-Pinned Inference Execution: AMD EPYC™ 9004 Series is a chiplet architecture in which cross–Core Complex Die (CCD) traffic carries a real latency penalty for tightly coupled workloads. zentorch inference instances are now pinned to whole CCDs, with the load-generator process placed out of the inference CCD.
Evaluation Step
The evaluation covers two representative AMD EPYC™ 9004 Series deployments:
- Baremetal (BM): 96-core AMD EPYC™ 9654 system in NPS4 memory configuration.
- Virtual machine (VM): 80-core AMD EPYC™ 9V74 system in NPS5 memory configuration, modeling the production environment of the target deployment.
- zentorch version 2.13.0.0, ZenDNN version 6.0, ONNX Runtime 1.17
The bechmark matrix sweeps sequence lenghts of 32, 64, 128, single-instance core counts of 8, and 16, and multi-instance configurations of 2,4, and 6 instances with 8 and 16 cores per instance. Each configuration is evaluated under physical-only core mapping. Each backend is executed 10 times, and median value is selected to minimize the run-to-run variations. The model is Hugging Face BERT-Base uncased; the datatypes are FP32 and BF16. Both stacks run with aligned tokenization, matched padding policy, a multiprocessing-based multi-instance driver, and identical core-affinity rules — so the reported gains reflect kernel and runtime improvements, not harness artifacts.
Results
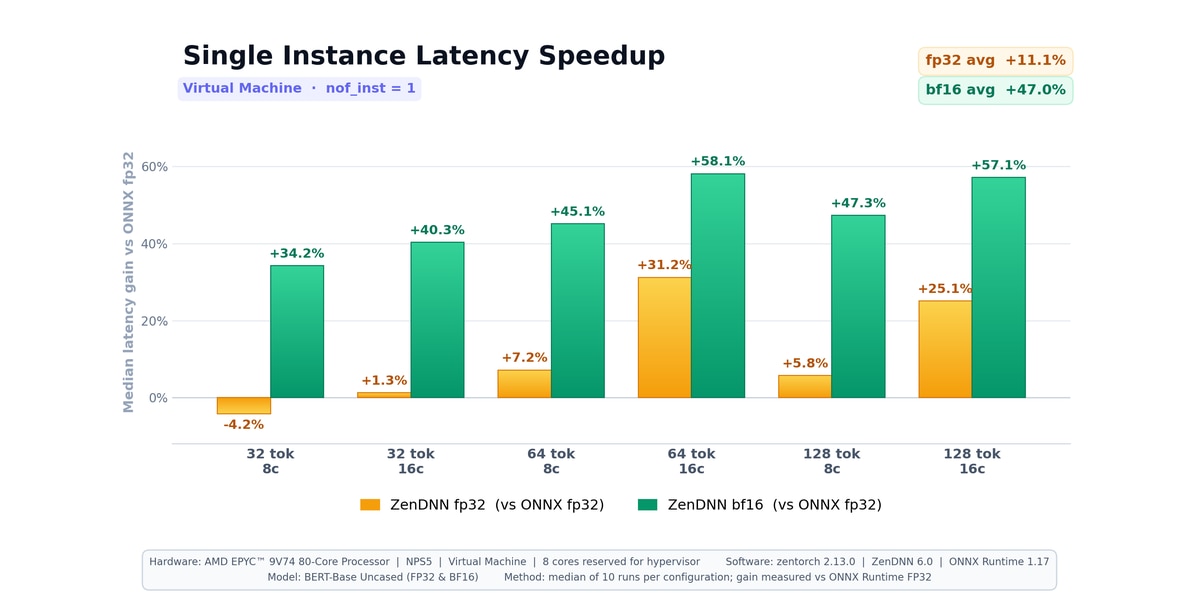
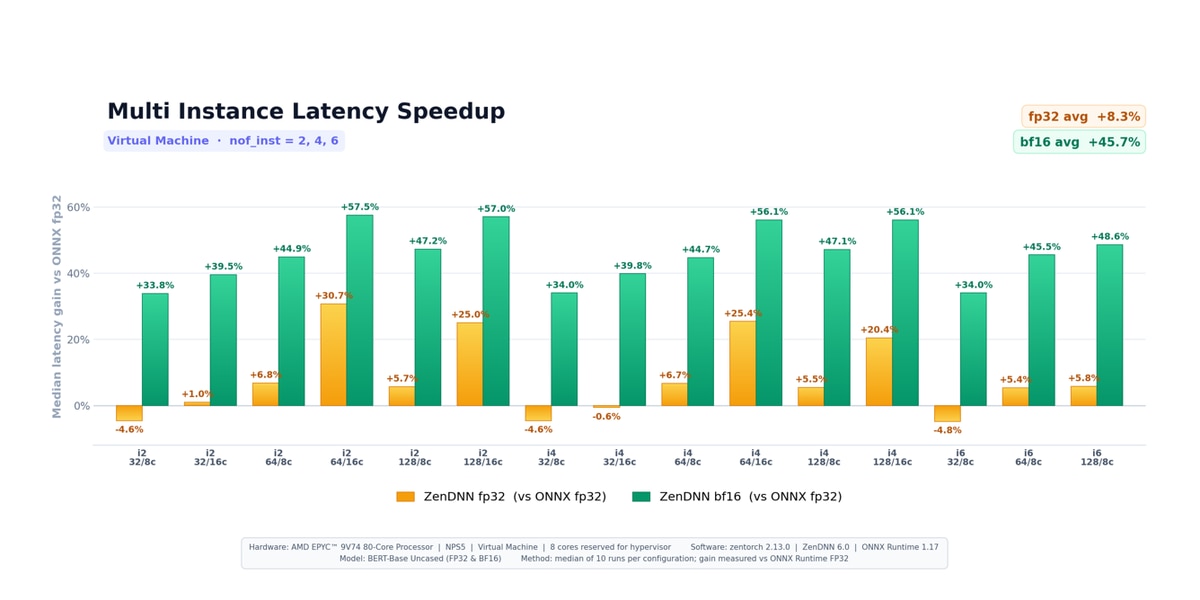
Out of 42 configurations (21 FP32 and 21 BF16, from 48 matrix points; the 6-instance, 16-core points were not runnable), zentorch wins on 35 (83%), is on on par on 4 (10%), and loses on 3 (7%) on BM5 and on the VM, zentorch wins on 35 (83%), is on par on 3 (7%), and loses on 4 (10%)6.
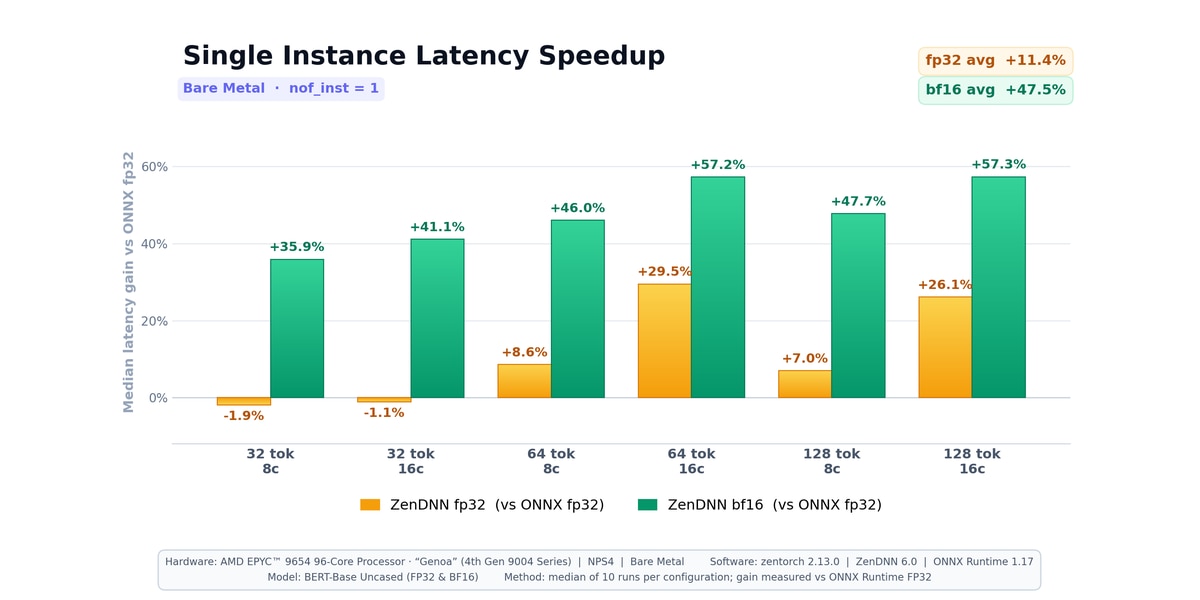
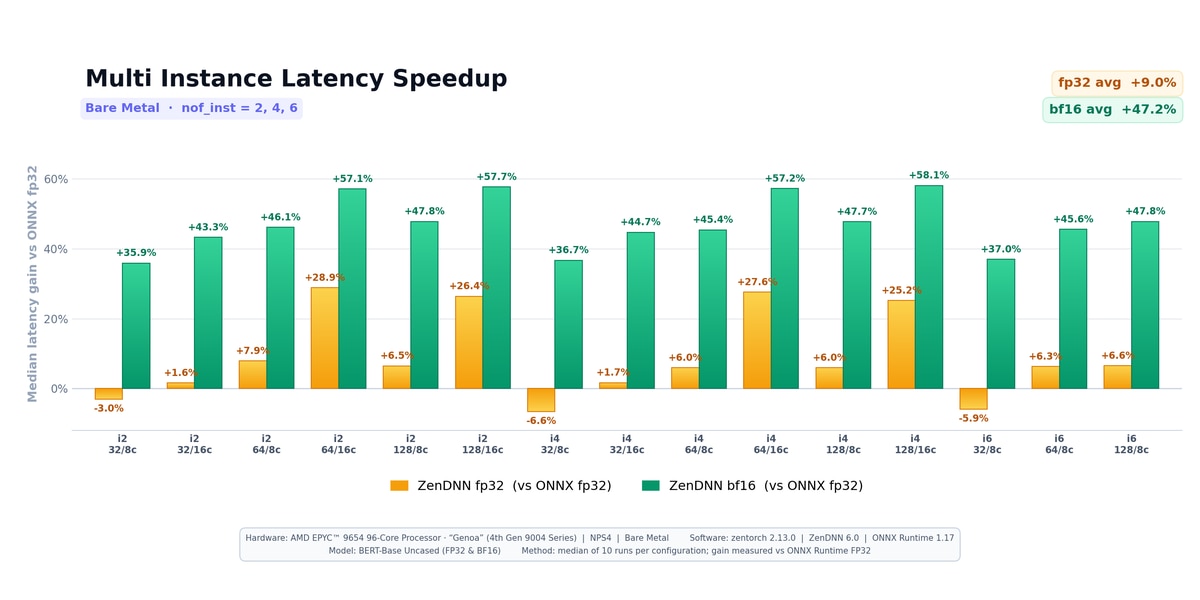
- FP32 (physical cores only, across all configs): approximately +9.7% avg gain on BM and +9.1% on the VM1, 3 vs ONNX Runtime FP32.
- BF16 (physical cores only, across all configs): approximately +47.3% avg gain on BM and +46.1% on the VM2, 4 vs ONNX Runtime FP32, the supported CPU baseline because ONNX Runtime has no native BF16 compute kernels.
Our Ongoing Commitment to the Ecosystem
This work continues our commitment to the open-source AI ecosystem. The graph-level fusions are part of the zentorch plugin, and the attention and MatMul kernel improvements are released through ZenDNN and AOCL-DLP, openly available to every team running Transformer inference on AMD EPYC™ CPUs. Try the latest ZenDNN and zentorch releases on GitHub, and share your feedback or production traces with us.
References
- PyTorch issue #175325 - Inductor storage-offset propagation with QKV-style fusion
- ZenDNN LOA DOC
- AOCL-DLP - A library of AMD-optimized deep learning primitives
- Hugging Face, "BERT base model (uncased)"
- ZenDNN Release: https://github.com/amd/ZenDNN/tree/v6.0.0
- zentorch Release: https://github.com/amd/ZenDNN-pytorch-plugin/tree/v2.13.0.0
Footnotes
Footnotes and Disclaimers
Testing by AMD as of September 2026
1 ZD-070: BERT-Base Uncased inference, zentorch FP32 versus ONNX Runtime FP32, on AMD EPYC™ 9654 (96 cores, 1 socket, SMT on, NPS4); ZenDNN 6.0, zentorch 2.13.0.0, ONNX Runtime 1.17.0; Hugging Face BERT-Base Uncased; sequence lengths 32/64/128; 1, 2, 4, 6 instances at 8 and 16 cores; physical cores; median of 10 runs. Single-instance average 11.4%; multi-instance average 9.0%; all-configuration average 9.7%; peak 29.5% at 1 instance(s), sequence length 64, 16 cores. zentorch leads on 14, on par on 4, trails on 3 of 21.
Per-workload latency gain versus ONNX Runtime (higher is better; instances=1 is single-instance, 2/4/6 are multi-instance):
instances seqlen cores latency_gain%
1 32 8 -1.9%
1 32 16 -1.1%
1 64 8 +8.6%
1 64 16 +29.5%
1 128 8 +7.0%
1 128 16 +26.1%
2 32 8 -3.0%
2 32 16 +1.6%
2 64 8 +7.9%
2 64 16 +28.9%
2 128 8 +6.5%
2 128 16 +26.4%
4 32 8 -6.6%
4 32 16 +1.7%
4 64 8 +6.0%
4 64 16 +27.6%
4 128 8 +6.0%
4 128 16 +25.2%
6 32 8 -5.9%
6 64 8 +6.3%
6 128 8 +6.6%
Results may vary due to factors including system configurations, software versions and BIOS settings.
2 ZD-071: BERT-Base Uncased inference, zentorch BF16 versus ONNX Runtime FP32, on AMD EPYC™ 9654 (96 cores, 1 socket, SMT on, NPS4); ZenDNN 6.0, zentorch 2.13.0.0, ONNX Runtime 1.17.0; Hugging Face BERT-Base Uncased; sequence lengths 32/64/128; 1, 2, 4, 6 instances at 8 and 16 cores; physical cores; median of 10 runs. Single-instance average 47.5%; multi-instance average 47.2%; all-configuration average 47.3%; peak 58.1% at 4 instance(s), sequence length 128, 16 cores. zentorch leads on 21, on par on 0, trails on 0 of 21.
Per-workload latency gain versus ONNX Runtime (higher is better; instances=1 is single-instance, 2/4/6 are multi-instance):
instances seqlen cores latency_gain%
1 32 8 +35.9%
1 32 16 +41.1%
1 64 8 +46.0%
1 64 16 +57.2%
1 128 8 +47.7%
1 128 16 +57.3%
2 32 8 +35.9%
2 32 16 +43.3%
2 64 8 +46.1%
2 64 16 +57.1%
2 128 8 +47.8%
2 128 16 +57.7%
4 32 8 +36.7%
4 32 16 +44.7%
4 64 8 +45.4%
4 64 16 +57.2%
4 128 8 +47.7%
4 128 16 +58.1%
6 32 8 +37.0%
6 64 8 +45.6%
6 128 8 +47.8%
Results may vary due to factors including system configurations, software versions and BIOS settings.
3 ZD-072: BERT-Base Uncased inference, zentorch FP32 versus ONNX Runtime FP32, on AMD EPYC™ 9V74 (80 cores, 1 socket, SMT on, NPS5, Hyper-V VM); ZenDNN 6.0, zentorch 2.13.0.0, ONNX Runtime 1.17.0; Hugging Face BERT-Base Uncased; sequence lengths 32/64/128; 1, 2, 4, 6 instances at 8 and 16 cores; physical cores; median of 10 runs. Single-instance average 11.1%; multi-instance average 8.3%; all-configuration average 9.1%; peak 31.2% at 1 instance(s), sequence length 64, 16 cores. zentorch leads on 14, on par on 3, trails on 4 of 21.
Per-workload latency gain versus ONNX Runtime (higher is better; instances=1 is single-instance, 2/4/6 are multi-instance):
instances seqlen cores latency_gain%
1 32 8 -4.2%
1 32 16 +1.3%
1 64 8 +7.2%
1 64 16 +31.2%
1 128 8 +5.8%
1 128 16 +25.1%
2 32 8 -4.6%
2 32 16 +1.0%
2 64 8 +6.8%
2 64 16 +30.7%
2 128 8 +5.7%
2 128 16 +25.0%
4 32 8 -4.6%
4 32 16 -0.6%
4 64 8 +6.7%
4 64 16 +25.4%
4 128 8 +5.5%
4 128 16 +20.4%
6 32 8 -4.8%
6 64 8 +5.4%
6 128 8 +5.8%
Results may vary due to factors including system configurations, software versions and BIOS settings.
4 ZD-073: BERT-Base Uncased inference, zentorch BF16 versus ONNX Runtime FP32, on AMD EPYC™ 9V74 (80 cores, 1 socket, SMT on, NPS5, Hyper-V VM); ZenDNN 6.0, zentorch 2.13.0.0, ONNX Runtime 1.17.0; Hugging Face BERT-Base Uncased; sequence lengths 32/64/128; 1, 2, 4, 6 instances at 8 and 16 cores; physical cores; median of 10 runs. Single-instance average 47.0%; multi-instance average 45.7%; all-configuration average 46.1%; peak 58.1% at 1 instance(s), sequence length 64, 16 cores. zentorch leads on 21, on par on 0, trails on 0 of 21.
Per-workload latency gain versus ONNX Runtime (higher is better; instances=1 is single-instance, 2/4/6 are multi-instance):
instances seqlen cores latency_gain%
1 32 8 +34.2%
1 32 16 +40.3%
1 64 8 +45.1%
1 64 16 +58.1%
1 128 8 +47.3%
1 128 16 +57.1%
2 32 8 +33.8%
2 32 16 +39.5%
2 64 8 +44.9%
2 64 16 +57.5%
2 128 8 +47.2%
2 128 16 +57.0%
4 32 8 +34.0%
4 32 16 +39.8%
4 64 8 +44.7%
4 64 16 +56.1%
4 128 8 +47.1%
4 128 16 +56.1%
6 32 8 +34.0%
6 64 8 +45.5%
6 128 8 +48.6%
Results may vary due to factors including system configurations, software versions and BIOS settings.
5 ZD-074: BERT-Base Uncased inference on AMD EPYC™ 9654 (96 cores, 1 socket, SMT on, NPS4); ZenDNN 6.0, zentorch 2.13.0.0, ONNX Runtime 1.17.0; Hugging Face BERT-Base Uncased; sequence lengths 32/64/128; 1, 2, 4, 6 instances at 8 and 16 cores; physical cores; median of 10 runs. Across 42 configurations (FP32 21 + BF16 vs ONNX FP32 21), zentorch wins 35 (83%), on par 4 (10%), loses 3 (7%).
Per-workload latency gain versus ONNX Runtime (higher is better):
instances seqlen cores FP32_gain% BF16_gain%
1 32 8 -1.9% +35.9%
1 32 16 -1.1% +41.1%
1 64 8 +8.6% +46.0%
1 64 16 +29.5% +57.2%
1 128 8 +7.0% +47.7%
1 128 16 +26.1% +57.3%
2 32 8 -3.0% +35.9%
2 32 16 +1.6% +43.3%
2 64 8 +7.9% +46.1%
2 64 16 +28.9% +57.1%
2 128 8 +6.5% +47.8%
2 128 16 +26.4% +57.7%
4 32 8 -6.6% +36.7%
4 32 16 +1.7% +44.7%
4 64 8 +6.0% +45.4%
4 64 16 +27.6% +57.2%
4 128 8 +6.0% +47.7%
4 128 16 +25.2% +58.1%
6 32 8 -5.9% +37.0%
6 64 8 +6.3% +45.6%
6 128 8 +6.6% +47.8%
Results may vary due to factors including system configurations, software versions and BIOS settings.
6 ZD-075: BERT-Base Uncased inference on AMD EPYC™ 9V74 (80 cores, 1 socket, SMT on, NPS5, Hyper-V VM); ZenDNN 6.0, zentorch 2.13.0.0, ONNX Runtime 1.17.0; Hugging Face BERT-Base Uncased; sequence lengths 32/64/128; 1, 2, 4, 6 instances at 8 and 16 cores; physical cores; median of 10 runs. Across 42 configurations (FP32 21 + BF16 vs ONNX FP32 21), zentorch wins 35 (83%), on par 3 (7%), loses 4 (10%).
Per-workload latency gain versus ONNX Runtime (higher is better):
instances seqlen cores FP32_gain% BF16_gain%
1 32 8 -4.2% +34.2%
1 32 16 +1.3% +40.3%
1 64 8 +7.2% +45.1%
1 64 16 +31.2% +58.1%
1 128 8 +5.8% +47.3%
1 128 16 +25.1% +57.1%
2 32 8 -4.6% +33.8%
2 32 16 +1.0% +39.5%
2 64 8 +6.8% +44.9%
2 64 16 +30.7% +57.5%
2 128 8 +5.7% +47.2%
2 128 16 +25.0% +57.0%
4 32 8 -4.6% +34.0%
4 32 16 -0.6% +39.8%
4 64 8 +6.7% +44.7%
4 64 16 +25.4% +56.1%
4 128 8 +5.5% +47.1%
4 128 16 +20.4% +56.1%
6 32 8 -4.8% +34.0%
6 64 8 +5.4% +45.5%
6 128 8 +5.8% +48.6%
Results may vary due to factors including system configurations, software versions and BIOS settings.
Footnotes
Footnotes and Disclaimers
Testing by AMD as of September 2026
1 ZD-070: BERT-Base Uncased inference, zentorch FP32 versus ONNX Runtime FP32, on AMD EPYC™ 9654 (96 cores, 1 socket, SMT on, NPS4); ZenDNN 6.0, zentorch 2.13.0.0, ONNX Runtime 1.17.0; Hugging Face BERT-Base Uncased; sequence lengths 32/64/128; 1, 2, 4, 6 instances at 8 and 16 cores; physical cores; median of 10 runs. Single-instance average 11.4%; multi-instance average 9.0%; all-configuration average 9.7%; peak 29.5% at 1 instance(s), sequence length 64, 16 cores. zentorch leads on 14, on par on 4, trails on 3 of 21.
Per-workload latency gain versus ONNX Runtime (higher is better; instances=1 is single-instance, 2/4/6 are multi-instance):
instances seqlen cores latency_gain%
1 32 8 -1.9%
1 32 16 -1.1%
1 64 8 +8.6%
1 64 16 +29.5%
1 128 8 +7.0%
1 128 16 +26.1%
2 32 8 -3.0%
2 32 16 +1.6%
2 64 8 +7.9%
2 64 16 +28.9%
2 128 8 +6.5%
2 128 16 +26.4%
4 32 8 -6.6%
4 32 16 +1.7%
4 64 8 +6.0%
4 64 16 +27.6%
4 128 8 +6.0%
4 128 16 +25.2%
6 32 8 -5.9%
6 64 8 +6.3%
6 128 8 +6.6%
Results may vary due to factors including system configurations, software versions and BIOS settings.
2 ZD-071: BERT-Base Uncased inference, zentorch BF16 versus ONNX Runtime FP32, on AMD EPYC™ 9654 (96 cores, 1 socket, SMT on, NPS4); ZenDNN 6.0, zentorch 2.13.0.0, ONNX Runtime 1.17.0; Hugging Face BERT-Base Uncased; sequence lengths 32/64/128; 1, 2, 4, 6 instances at 8 and 16 cores; physical cores; median of 10 runs. Single-instance average 47.5%; multi-instance average 47.2%; all-configuration average 47.3%; peak 58.1% at 4 instance(s), sequence length 128, 16 cores. zentorch leads on 21, on par on 0, trails on 0 of 21.
Per-workload latency gain versus ONNX Runtime (higher is better; instances=1 is single-instance, 2/4/6 are multi-instance):
instances seqlen cores latency_gain%
1 32 8 +35.9%
1 32 16 +41.1%
1 64 8 +46.0%
1 64 16 +57.2%
1 128 8 +47.7%
1 128 16 +57.3%
2 32 8 +35.9%
2 32 16 +43.3%
2 64 8 +46.1%
2 64 16 +57.1%
2 128 8 +47.8%
2 128 16 +57.7%
4 32 8 +36.7%
4 32 16 +44.7%
4 64 8 +45.4%
4 64 16 +57.2%
4 128 8 +47.7%
4 128 16 +58.1%
6 32 8 +37.0%
6 64 8 +45.6%
6 128 8 +47.8%
Results may vary due to factors including system configurations, software versions and BIOS settings.
3 ZD-072: BERT-Base Uncased inference, zentorch FP32 versus ONNX Runtime FP32, on AMD EPYC™ 9V74 (80 cores, 1 socket, SMT on, NPS5, Hyper-V VM); ZenDNN 6.0, zentorch 2.13.0.0, ONNX Runtime 1.17.0; Hugging Face BERT-Base Uncased; sequence lengths 32/64/128; 1, 2, 4, 6 instances at 8 and 16 cores; physical cores; median of 10 runs. Single-instance average 11.1%; multi-instance average 8.3%; all-configuration average 9.1%; peak 31.2% at 1 instance(s), sequence length 64, 16 cores. zentorch leads on 14, on par on 3, trails on 4 of 21.
Per-workload latency gain versus ONNX Runtime (higher is better; instances=1 is single-instance, 2/4/6 are multi-instance):
instances seqlen cores latency_gain%
1 32 8 -4.2%
1 32 16 +1.3%
1 64 8 +7.2%
1 64 16 +31.2%
1 128 8 +5.8%
1 128 16 +25.1%
2 32 8 -4.6%
2 32 16 +1.0%
2 64 8 +6.8%
2 64 16 +30.7%
2 128 8 +5.7%
2 128 16 +25.0%
4 32 8 -4.6%
4 32 16 -0.6%
4 64 8 +6.7%
4 64 16 +25.4%
4 128 8 +5.5%
4 128 16 +20.4%
6 32 8 -4.8%
6 64 8 +5.4%
6 128 8 +5.8%
Results may vary due to factors including system configurations, software versions and BIOS settings.
4 ZD-073: BERT-Base Uncased inference, zentorch BF16 versus ONNX Runtime FP32, on AMD EPYC™ 9V74 (80 cores, 1 socket, SMT on, NPS5, Hyper-V VM); ZenDNN 6.0, zentorch 2.13.0.0, ONNX Runtime 1.17.0; Hugging Face BERT-Base Uncased; sequence lengths 32/64/128; 1, 2, 4, 6 instances at 8 and 16 cores; physical cores; median of 10 runs. Single-instance average 47.0%; multi-instance average 45.7%; all-configuration average 46.1%; peak 58.1% at 1 instance(s), sequence length 64, 16 cores. zentorch leads on 21, on par on 0, trails on 0 of 21.
Per-workload latency gain versus ONNX Runtime (higher is better; instances=1 is single-instance, 2/4/6 are multi-instance):
instances seqlen cores latency_gain%
1 32 8 +34.2%
1 32 16 +40.3%
1 64 8 +45.1%
1 64 16 +58.1%
1 128 8 +47.3%
1 128 16 +57.1%
2 32 8 +33.8%
2 32 16 +39.5%
2 64 8 +44.9%
2 64 16 +57.5%
2 128 8 +47.2%
2 128 16 +57.0%
4 32 8 +34.0%
4 32 16 +39.8%
4 64 8 +44.7%
4 64 16 +56.1%
4 128 8 +47.1%
4 128 16 +56.1%
6 32 8 +34.0%
6 64 8 +45.5%
6 128 8 +48.6%
Results may vary due to factors including system configurations, software versions and BIOS settings.
5 ZD-074: BERT-Base Uncased inference on AMD EPYC™ 9654 (96 cores, 1 socket, SMT on, NPS4); ZenDNN 6.0, zentorch 2.13.0.0, ONNX Runtime 1.17.0; Hugging Face BERT-Base Uncased; sequence lengths 32/64/128; 1, 2, 4, 6 instances at 8 and 16 cores; physical cores; median of 10 runs. Across 42 configurations (FP32 21 + BF16 vs ONNX FP32 21), zentorch wins 35 (83%), on par 4 (10%), loses 3 (7%).
Per-workload latency gain versus ONNX Runtime (higher is better):
instances seqlen cores FP32_gain% BF16_gain%
1 32 8 -1.9% +35.9%
1 32 16 -1.1% +41.1%
1 64 8 +8.6% +46.0%
1 64 16 +29.5% +57.2%
1 128 8 +7.0% +47.7%
1 128 16 +26.1% +57.3%
2 32 8 -3.0% +35.9%
2 32 16 +1.6% +43.3%
2 64 8 +7.9% +46.1%
2 64 16 +28.9% +57.1%
2 128 8 +6.5% +47.8%
2 128 16 +26.4% +57.7%
4 32 8 -6.6% +36.7%
4 32 16 +1.7% +44.7%
4 64 8 +6.0% +45.4%
4 64 16 +27.6% +57.2%
4 128 8 +6.0% +47.7%
4 128 16 +25.2% +58.1%
6 32 8 -5.9% +37.0%
6 64 8 +6.3% +45.6%
6 128 8 +6.6% +47.8%
Results may vary due to factors including system configurations, software versions and BIOS settings.
6 ZD-075: BERT-Base Uncased inference on AMD EPYC™ 9V74 (80 cores, 1 socket, SMT on, NPS5, Hyper-V VM); ZenDNN 6.0, zentorch 2.13.0.0, ONNX Runtime 1.17.0; Hugging Face BERT-Base Uncased; sequence lengths 32/64/128; 1, 2, 4, 6 instances at 8 and 16 cores; physical cores; median of 10 runs. Across 42 configurations (FP32 21 + BF16 vs ONNX FP32 21), zentorch wins 35 (83%), on par 3 (7%), loses 4 (10%).
Per-workload latency gain versus ONNX Runtime (higher is better):
instances seqlen cores FP32_gain% BF16_gain%
1 32 8 -4.2% +34.2%
1 32 16 +1.3% +40.3%
1 64 8 +7.2% +45.1%
1 64 16 +31.2% +58.1%
1 128 8 +5.8% +47.3%
1 128 16 +25.1% +57.1%
2 32 8 -4.6% +33.8%
2 32 16 +1.0% +39.5%
2 64 8 +6.8% +44.9%
2 64 16 +30.7% +57.5%
2 128 8 +5.7% +47.2%
2 128 16 +25.0% +57.0%
4 32 8 -4.6% +34.0%
4 32 16 -0.6% +39.8%
4 64 8 +6.7% +44.7%
4 64 16 +25.4% +56.1%
4 128 8 +5.5% +47.1%
4 128 16 +20.4% +56.1%
6 32 8 -4.8% +34.0%
6 64 8 +5.4% +45.5%
6 128 8 +5.8% +48.6%
Results may vary due to factors including system configurations, software versions and BIOS settings.


Related Blogs
-
Online Quantization: Smooth Path from One Checkpoint to Any Desired Serving Scenario — ROCm Blogs
Learn how AMD Quark's online quantization quantizes LLM weights at load time across vLLM, ATOM, and SGLang, with per-layer mixed FP8/MXFP4 recipes.
November 04, 2026
-
Device Memory Load Issue Stalls and Scheduling Opportunities in Lock-Stepped Kernels on AMD Instinct™ MI300X — ROCm Blogs
Diagnosing and reducing device-memory load issue stalls in lock-stepped kernels on AMD Instinct MI300X by interleaving compute.
November 01, 2026
-
How to Scale Diffusion Inference Across AMD RDNA 4 GPUs — ROCm Blogs
Run xDiT image and video diffusion workloads on multiple RDNA 4 GPUs with practical guidance for latency, memory, and scaling.
November 01, 2026
-
Two Waves, One Stage Apart: Warp-Pipelining Triton GEMMs on AMD Instinct — ROCm Blogs
Use warp-pipelining to overlap matrix work and data preparation in compute-bound Triton GEMMs on AMD Instinct GPUs.
October 26, 2026
-
Training EAGLE3 Speculative Decoding Draft Models on AMD Instinct MI350X with AMD Quark — ROCm Blogs
Learn how the AMD Quark team trains EAGLE3.1 draft models from scratch on AMD Instinct MI350X GPUs using ROCm, vLLM, TorchSpec, and SPEED-Bench.
October 26, 2026
-
Group-GEMM in XLA: Making Mixture-of-Experts Fast and Memory-Efficient — ROCm Blogs
Learn how to make JAX/MaxText MoE training more efficient with two new OpenXLA Group-GEMM backends for ragged-dot: ROCm hipBLASLt and generic Triton.
October 25, 2026
-
Scaling 3D Gaussian Splatting with Distributed Compute: Why One GPU Is Never Enough — ROCm Blogs
Learn how to scale 3D Gaussian splatting across GPUs with distributed training, RCCL, and real-world optimization tips for AMD Instinct GPUs
October 22, 2026
-
FP8 GEMM Optimization on AMD RDNA™ 4 Architecture — ROCm Blogs
Learn how to port an FP16 GEMM kernel to FP8 on AMD RDNA 4 and use the smaller element size to unlock larger tiles and deeper K slices.
October 22, 2026