
Overview
AMD is a full member of the Responsible Business Alliance (RBA) and adopts the RBA Code of Conduct as the AMD Supplier Code of Conduct, which covers labor, health and safety, environment, ethics and management systems.
In 2025, 81 RBA Validated Assessment Program (VAP) audits across AMD Manufacturing Supplier facilities were conducted by approved third-party firms. The average initial VAP audit score for AMD Manufacturing Suppliers was 13% higher than the overall RBA average during the same period.
Of the 63 initial audits conducted during the year, 74% of factories obtained VAP Recognition for their commitment to social and environmental responsibility1. Among those recognized factories, 33% achieved platinum, 17% achieved gold and 50% achieved silver recognition.
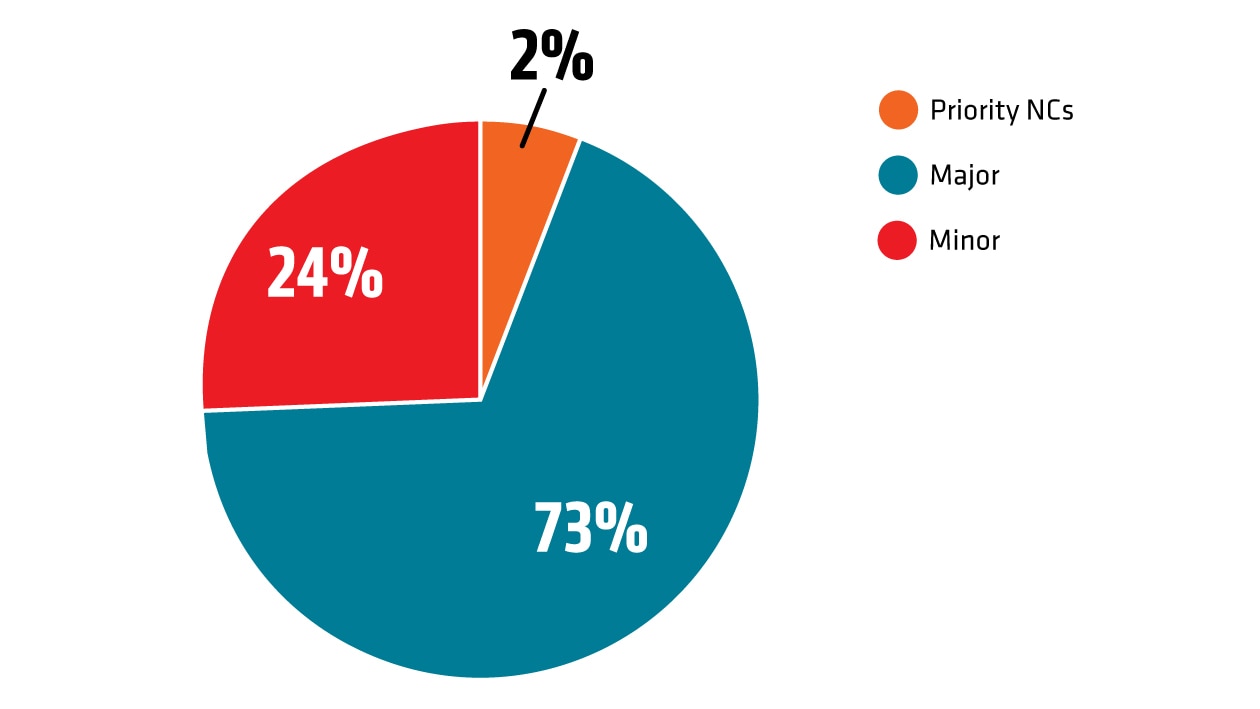
The VAP audit categorizes nonconformances by severity as Minor, Major or Priority. In 2025, 64% of all nonconformances identified in these audits were classified as Major, and all affected suppliers were required to complete corrective action plans. Common Major nonconformances2 related to labor control processes, working hours, wages and benefits, emergency preparedness and supplier responsibility.
AMD Average RBA VAP Score Compared to the Electronics Industry Average (2025)
Percentage of Nonconformances by Rating (2025
Remediation
All three finding categories have specified periods during which the audited facility must remedy the findings and implement systems to prevent recurrences. AMD Manufacturing Suppliers are required to manage and close corrective action plan (CAP) in accordance with the RBA VAP Protocol. If suppliers are unable to meet AMD requirements, AMD executives are notified so appropriate action can be taken.
Measuring Effectiveness
We take a continuous improvement approach to helping our Manufacturing Suppliers to improve compliance with the Supplier Code of Conduct. Among suppliers that had an initial and closure audit in 2025, the audit score increased by 42% on average from initial audit to closure.3 Our Manufacturing Suppliers are required to score at least 160 on the VAP audit and close any Priority findings. Several suppliers that were not required to have a closure audit opted to have one and increased their scores, in some cases from silver to platinum VAP recognition.
Audits Conducted by Location (2025)
| Region/Country | # Initial Audits | # Closure Audits4 | Priority Closure Audit |
| Greater China | 33 | 6 | 0 |
| Japan | 5 | 1 | 0 |
| Malaysia | 8 | 2 | 1 |
| Philippines | 2 | 1 | 0 |
| Singapore | 2 | 0 | 0 |
| South Korea | 4 | 4 | 0 |
| Thailand | 4 | 1 | 0 |
| United States | 4 | 1 | 0 |
| Vietnam | 1 | 0 | 0 |
| TOTAL | 63 | 17 | 1 |
All nonconformances (NCs) by section of the AMD Supplier Code of Conduct (2025)
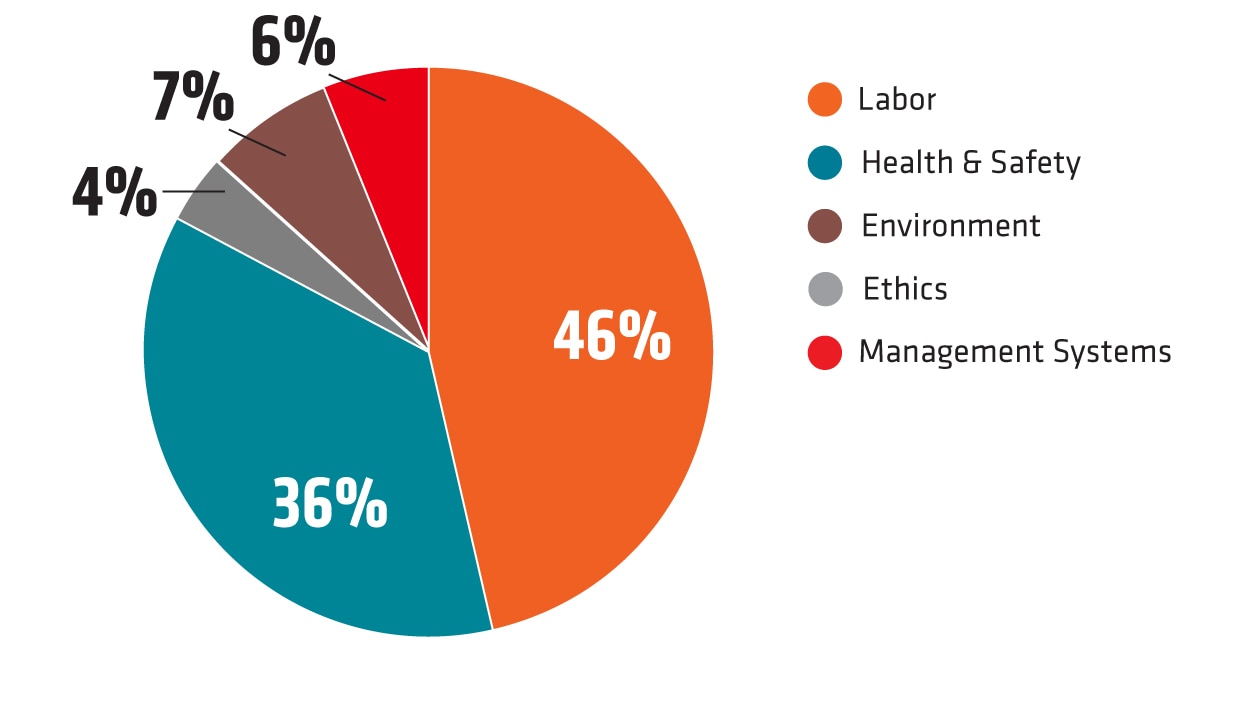
2025 Manufacturing Supplier Audit Results
Nonconformances by Type, Initial Audits (2025)5
| Code Section | Priority | Major | Minor | Percentage |
| Labor | 3 | 74 | 29 | 37% |
| Risk assessment | 0 | 8 | 4 | |
| Control processes | 0 | 25 | 9 | |
| Performance review and continuous improvement | 0 | 7 | 2 | |
| Prohibition of forced labor | 3 | 7 | 1 | |
| Working hours | 0 | 19 | 9 | |
| Wages and benefits | 0 | 5 | 1 | |
| Non-discrimination / non-harassment / humane treatment | 0 | 3 | 3 | |
| Health and Safety | 4 | 61 | 39 | 37% |
| Risk assessment | 0 | 3 | 4 | |
| Control processes | 0 | 9 | 14 | |
| Communications | 0 | 5 | 7 | |
| Performance review and continuous improvement | 0 | 2 | 4 | |
| Occupational health and safety | 0 | 12 | 3 | |
| Emergency preparedness | 4 | 19 | 6 | |
| Occupational injury and illness | 0 | 1 | 0 | |
| Industrial hygiene | 0 | 3 | 1 | |
| Machine safeguarding | 0 | 3 | 0 | |
| Food, sanitation and housing | 0 | 4 | 0 | |
| Environment | 0 | 11 | 14 | 9% |
| Risk assessment | 0 | 2 | 2 | |
| Control processes | 0 | 1 | 4 | |
| Communications | 0 | 0 | 6 | |
| Performance review and continuous improvement | 0 | 1 | 2 | |
| Solid waste | 0 | 1 | 0 | |
| Air emissions | 0 | 1 | 0 | |
| Water management | 0 | 1 | 0 | |
| Energy consumption and greenhouse gas emissions | 0 | 4 | 0 | |
| Ethics | 3 | 19 | 5 | 10% |
| Risk assessment | 0 | 5 | 3 | |
| Control processes | 0 | 4 | 2 | |
| Performance review and continuous improvement | 0 | 7 | 0 | |
| Business integrity and no improper advantage | 0 | 2 | 0 | |
| Disclosure of information | 3 | 0 | 0 | |
| Privacy | 0 | 1 | 0 | |
| Supply Chain Managament | 2 | 17 | 3 | 8% |
| Materials restrictions | 0 | 1 | 0 | |
| Supplier responsibility | 2 | 16 | 3 | |
| Total | 12 | 182 | 90 | 100% |
Nonconformances by Location, Initial Audits (2025)
| Location / Category | A) Labor | B) Health and Safety | C) Environment | D) Ethics | E) Supply Chain Management | Total |
| Greater China | 41 | 44 | 10 | 3 | 8 | 110 |
| Japan | 4 | 2 | 1 | 0 | 0 | 7 |
| Malaysia | 25 | 21 | 6 | 5 | 6 | 63 |
| Philippines | 8 | 12 | 3 | 6 | 2 | 31 |
| Singapore | 2 | 5 | 0 | 1 | 2 | 10 |
| South Korea | 10 | 10 | 5 | 6 | 0 | 31 |
| Thailand | 11 | 2 | 0 | 1 | 4 | 18 |
| United States | 2 | 6 | 0 | 1 | 0 | 9 |
| Vietnam | 3 | 2 | 0 | 0 | 0 | 5 |
2024 Manufacturing Supplier Audit Results
2024 Manufacturing Supplier Audit Results
Nonconformances by Type, Initial Audits (2024)5
| Priority | Major | Minor | Total | Percentage | |
| Labor | 2 | 42 | 13 | 57 | 46% |
| Control processes | 0 | 15 | 5 | 20 | |
| Communications | 0 | 1 | 0 | 1 | |
| Performance review and continuous improvement | 0 | 1 | 0 | 1 | |
| Prohibition of forced labor | 2 | 7 | 2 | 11 | |
| Working hours | 0 | 11 | 3 | 14 | |
| Wages and benefits | 0 | 7 | 2 | 9 | |
| Non-discrimination / non-harassment / humane treatment | 0 | 0 | 1 | 1 | |
| Health and Safety | 0 | 33 | 12 | 45 | 36% |
| Risk assessment | 0 | 1 | 0 | 1 | |
| Control processes | 0 | 6 | 2 | 8 | |
| Communications | 0 | 6 | 4 | 10 | |
| Performance review and continuous improvement | 0 | 1 | 1 | 2 | |
| Occupational health and safety | 0 | 4 | 2 | 6 | |
| Emergency preparedness | 0 | 9 | 3 | 12 | |
| Occupational injury and illness | 0 | 1 | 0 | 1 | |
| Industrial hygiene | 0 | 3 | 0 | 3 | |
| Machine safeguarding | 0 | 1 | 0 | 1 | |
| Food, sanitation and housing | 0 | 1 | 0 | 1 | |
| Environment | 0 | 6 | 3 | 9 | 7% |
| Control processes | 0 | 1 | 0 | 1 | |
| Communications | 0 | 2 | 2 | 4 | |
| Solid waste | 0 | 0 | 1 | 1 | |
| Air emissions | 0 | 1 | 0 | 1 | |
| Water management | 0 | 1 | 0 | 1 | |
| Energy consumption and greenhouse gas emissions | 0 | 1 | 0 | 1 | |
| Ethics | 1 | 4 | 0 | 5 | 4% |
| Control processes | 0 | 2 | 0 | 2 | |
| Communications | 0 | 2 | 0 | 2 | |
| Disclosure of information | 1 | 0 | 0 | 1 | |
| Supply Chain Management | 0 | 6 | 2 | 8 | 6% |
| Responsible sourcing of minerals | 0 | 0 | 1 | 1 | |
| Supplier responsibility | 0 | 6 | 1 | 7 | |
| TOTAL | 3 | 91 | 30 | 124 | 100% |
Nonconformances by Location, Initial Audits (2024)
| Location / Category | A) Labor | B) Health and Safety | C) Environment | D) Ethics | E) Management Systems | Total |
| Greater China | 31 | 31 | 7 | 1 | 6 | 77 |
| Japan | 5 | 3 | 1 | 2 | 0 | 11 |
| Malaysia | 6 | 0 | 0 | 0 | 0 | 6 |
| Philippines | 3 | 2 | 0 | 0 | 0 | 5 |
| Singapore | 6 | 2 | 0 | 1 | 1 | 10 |
| South Korea | 6 | 7 | 1 | 0 | 1 | 15 |
2023 Manufacturing Supplier Audit Results
Nonconformances by Type, Initial Audits (2023)5
| Priority | Major | Minor | Total | Percentage | |
| Labor | 6 | 45 | 8 | 59 | 30% |
| Freely chosen employment | 2 | 4 | 0 | 6 | |
| Child labor avoidance | 1 | 1 | 2 | 4 | |
| Working hours | 2 | 10 | 1 | 13 | |
| Wages and benefits | 1 | 6 | 2 | 9 | |
| Control processes | 0 | 10 | 2 | 12 | |
| Performance review and continuous improvement | 0 | 7 | 1 | 8 | |
| Risk assessment | 0 | 4 | 0 | 4 | |
| Communications | 0 | 2 | 0 | 2 | |
| Non-discrimination | 0 | 1 | 0 | 1 | |
| Health and Safety | 5 | 54 | 16 | 75 | 38% |
| Occupational safety | 0 | 11 | 1 | 12 | |
| Emergency preparedness | 3 | 13 | 5 | 21 | |
| Occupational injury and illness | 0 | 2 | 3 | 5 | |
| Machine safeguarding | 0 | 0 | 1 | 1 | |
| Food, sanitation and housing | 2 | 4 | 2 | 8 | |
| Health and safety communication | 0 | 1 | 0 | 1 | |
| Control processes | 0 | 9 | 4 | 13 | |
| Risk assessment | 0 | 4 | 0 | 4 | |
| Communications | 0 | 2 | 0 | 2 | |
| Performance review and continuous improvement | 0 | 6 | 0 | 6 | |
| Industrial hygiene | 0 | 2 | 0 | 2 | |
| Environment | 0 | 18 | 1 | 19 | 10% |
| Environmental permits and reporting | 0 | 1 | 0 | 1 | |
| Hazardous substances | 0 | 4 | 0 | 4 | |
| Solid waste | 0 | 1 | 1 | 2 | |
| Performance review and continuous improvement | 0 | 3 | 0 | 3 | |
| Risk assessment | 0 | 3 | 0 | 3 | |
| Control processes | 0 | 4 | 0 | 4 | |
| Communications | 0 | 2 | 0 | 2 | |
| Ethics | 3 | 14 | 3 | 20 | 10% |
| No improper advantage | 1 | 0 | 2 | 3 | |
| Performance review and continuous improvement | 0 | 6 | 1 | 7 | |
| Protection of identity and non-retaliation | 1 | 0 | 0 | 1 | |
| Risk assessment | 0 | 4 | 0 | 4 | |
| Control processes | 1 | 2 | 0 | 3 | |
| Communications | 0 | 2 | 0 | 2 | |
| Management Systems | 0 | 19 | 3 | 22 | 11% |
| Supplier responsibility | 0 | 13 | 2 | 15 | |
| Legal and customer requirements | 0 | 1 | 1 | 2 | |
| Audits and assessments | 0 | 1 | 0 | 1 | |
| Materials restrictions | 0 | 2 | 0 | 2 | |
| Responsible sourcing of minerals | 0 | 2 | 0 | 2 | |
| TOTAL | 195 | 100% |
Nonconformances by Location, Initial Audits (2023)
| Location / Category | A) Labor | B) Health and Safety | C) Environment | D) Ethics | E) Management Systems | Total |
| Greater China | 23 | 29 | 2 | 1 | 5 | 60 |
| Czech Republic | 13 | 13 | 4 | 8 | 6 | 44 |
| Japan | 1 | 0 | 0 | 1 | 1 | 3 |
| Malaysia | 4 | 7 | 1 | 1 | 1 | 14 |
| Philippines | 0 | 3 | 0 | 0 | 0 | 3 |
| Singapore | 1 | 0 | 0 | 0 | 0 | 2 |
| South Korea | 1 | 5 | 1 | 0 | 0 | 7 |
| Thailand | 1 | 0 | 0 | 1 | 1 | 3 |
| United States | 15 | 18 | 11 | 8 | 7 | 59 |
2022 Manufacturing Supplier Audit Results
Nonconformances by Type, Initial Audits (2022)
| Priority | Major | Minor | Total | Percentage | |
| Labor | 1 | 42 | 10 | 53 | 40% |
| Freely chosen employment | 1 | 10 | 4 | 15 | |
| Young workers | 0 | 0 | 1 | 1 | |
| Working hours | 0 | 21 | 3 | 24 | |
| Wages and benefits | 0 | 9 | 1 | 10 | |
| Humane treatment | 0 | 0 | 0 | 0 | |
| Non-discrimination | 0 | 2 | 1 | 3 | |
| Freedom of association | 0 | 0 | 0 | 0 | |
| Health and Safety | 7 | 39 | 14 | 60 | 45% |
| Occupational safety | 0 | 8 | 4 | 12 | |
| Emergency preparedness | 4 | 13 | 6 | 23 | |
| Occupational injury and illness | 0 | 8 | 1 | 9 | |
| Industrial hygiene | 0 | 0 | 1 | 1 | |
| Physically demanding work | 0 | 1 | 1 | 2 | |
| Machine safeguarding | 0 | 1 | 0 | 1 | |
| Food, sanitation and housing | 3 | 7 | 1 | 11 | |
| Health and safety communication | 0 | 1 | 0 | 1 | |
| Environment | 0 | 6 | 3 | 9 | 7% |
| Environmental permits and reporting | 0 | 1 | 0 | 1 | |
| Pollution prevention and resource reduction | 0 | 0 | 0 | 0 | |
| Hazardous substances | 0 | 3 | 2 | 5 | |
| Solid waste | 0 | 0 | 0 | 0 | |
| Air emissions | 0 | 1 | 0 | 0 | |
| Materials restrictions | 0 | 0 | 0 | 0 | |
| Water management | 0 | 1 | 0 | 1 | |
| Energy consumption and greenhouse gas emissions | 0 | 0 | 1 | 1 | |
| Ethics | 0 | 1 | 1 | 2 | 1% |
| Business integrity | 0 | 0 | 0 | 0 | |
| No improper advantage | 0 | 0 | 1 | 1 | |
| Disclosure of information | 0 | 0 | 0 | 0 | |
| Intellectual property | 0 | 0 | 0 | 0 | |
| Fair business, advertising and competition | 0 | 0 | 0 | 0 | |
| Protection of identity and non-retaliation | 0 | 0 | 0 | 0 | |
| Responsible sourcing of minerals | 0 | 1 | 0 | 1 | |
| Privacy | 0 | 0 | 0 | 0 | |
| Management Systems | 0 | 7 | 3 | 10 | 7% |
| Company commitment | 0 | 0 | 0 | 0 | |
| Management accountability and responsibility | 0 | 0 | 0 | 0 | |
| Legal and customer requirements | 0 | 2 | 0 | 2 | |
| Risk assessment and risk management | 0 | 0 | 0 | 0 | |
| Improvement objectives | 0 | 1 | 0 | 1 | |
| Training | 0 | 0 | 0 | 0 | |
| Communication | 0 | 0 | 0 | 0 | |
| Worker feedback and participation | 0 | 1 | 0 | 1 | |
| Audits and assessments | 0 | 0 | 0 | 0 | |
| Corrective action process | 0 | 0 | 0 | 0 | |
| Documentation and records | 0 | 0 | 0 | 0 | |
| Supplier responsibility | 0 | 3 | 3 | 6 | |
| TOTAL | 134 | 100% |
Nonconformances by Location, Initial Audits (2022)
| Location / Category | A) Labor | B) Health & Safety | C) Environment | D) Ethics | E) Management Systems | Grand Total |
| Greater China | 39 | 34 | 7 | 1 | 4 | 85 |
| Japan | 6 | 12 | 2 | 4 | 24 | |
| Malaysia | 3 | 7 | 1 | 11 | ||
| Singapore | 3 | 1 | 1 | 5 | ||
| South Korea | 2 | 6 | 1 | 9 |
Footnotes
- Data includes all AMD Manufacturing Suppliers with eligible VAP Recognition Program data in 2025. VAPs are valid for two years.
- Data represents global rates of all NCs of sites audited in the calendar year.
- Data includes all initial and closure audits that took place in the calendar year.
- A closure audit verifies whether findings from a previous audit have been addressed and not all findings require a closure audit.
- Data is from full, initial VAP audits conducted in the calendar year. AMD aggregates all nonconformances (NCs) across all audits to determine NCs by RBA category.
Data
is from full, initial VAP audits conducted in the calendar year. AMD aggregates
all nonconformances (NCs) across all audits to determine NCs by RBA category.
- Data includes all AMD Manufacturing Suppliers with eligible VAP Recognition Program data in 2025. VAPs are valid for two years.
- Data represents global rates of all NCs of sites audited in the calendar year.
- Data includes all initial and closure audits that took place in the calendar year.
- A closure audit verifies whether findings from a previous audit have been addressed and not all findings require a closure audit.
- Data is from full, initial VAP audits conducted in the calendar year. AMD aggregates all nonconformances (NCs) across all audits to determine NCs by RBA category.
Data is from full, initial VAP audits conducted in the calendar year. AMD aggregates all nonconformances (NCs) across all audits to determine NCs by RBA category.