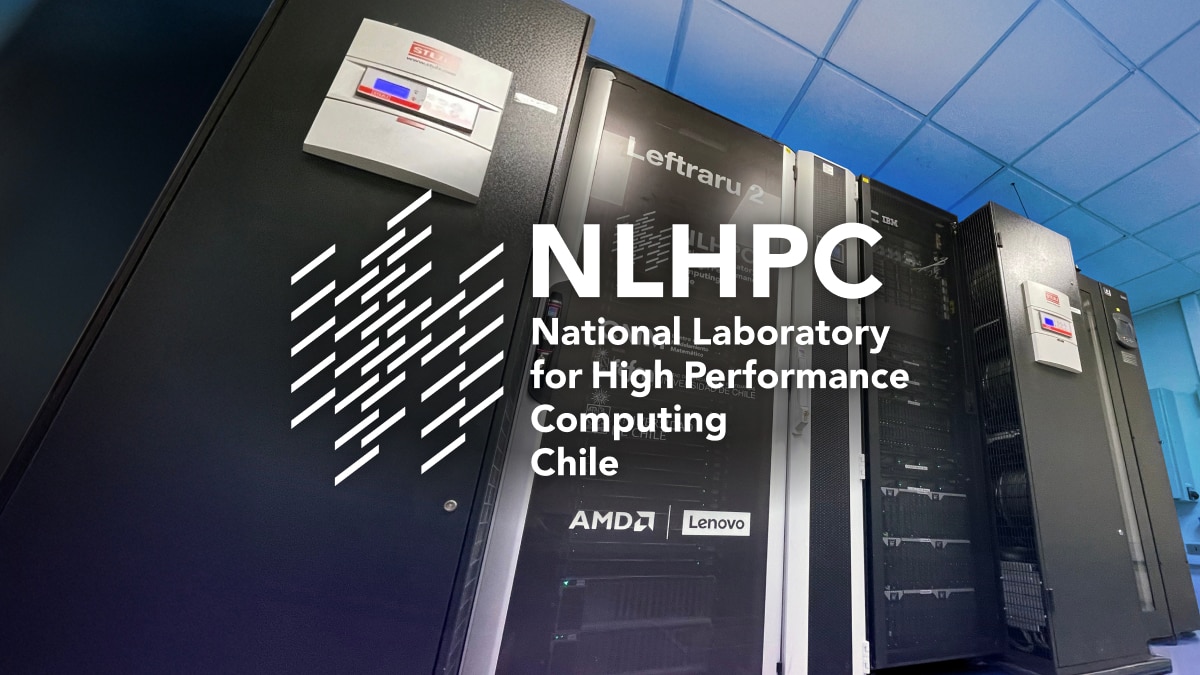
Chile’s NLHPC supercharged research performance with AMD
The National Laboratory for HPC in Chile doubled its scientific research performance per watt with AMD EPYC™ CPUs and AMD Instinct™ GPUs.

At AMD, energy efficiency has long been a guiding core design principle aligned to our roadmap and product strategy. For more than a decade, we have set public, time-bound goals to dramatically increase energy efficiency across the breadth of our portfolio and have consistently met and exceeded those targets.
As AI continues to scale and as we move toward true end-to-end design of full AI systems, the need for innovative energy solutions is becoming increasingly important – perhaps nowhere more so than in the data center.
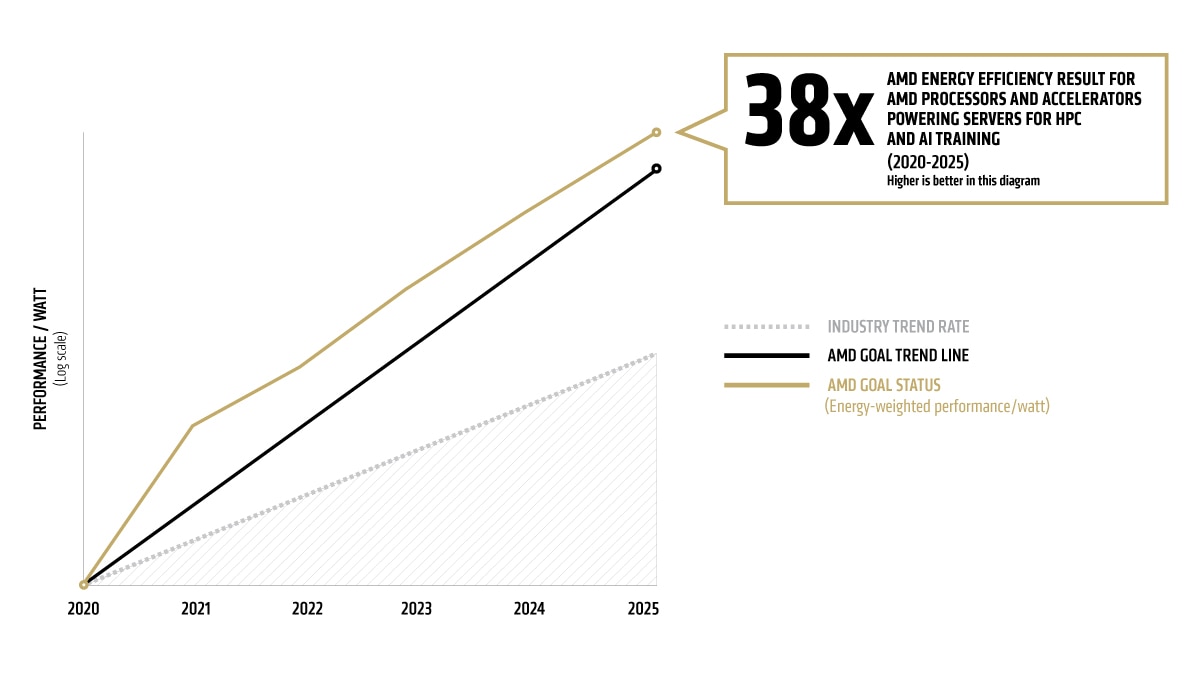
Our goal is to deliver a 30x increase in energy efficiency for AMD processors and accelerators powering servers for AI-training and HPC from 2020-2025.1 These important and growing computing segments have some of the most demanding workloads. This goal represents more than a 2.5x acceleration of the industry trends from 2015-2020 as measured by the worldwide energy consumption for these computing segments.2
Our 30x energy efficiency goal equates to a 97% reduction in energy use per computation from 2020-2025. If all AI and HPC server nodes globally were to make similar gains, billions of kilowatt-hours of electricity could be saved in 2025 relative to baseline trends.
As of mid-2025, we have achieved a 38x3 improvement over the base system using a configuration of four AMD Instinct™ MI355X GPUs and one AMD EPYC™ 5th Gen CPU. Our progress report utilizes methodology2 validated by renowned compute energy efficiency researcher and author, Dr. Jonathan Koomey.
As workloads scale and demand continues to rise, node-level efficiency gains won't keep pace. The most significant efficiency impact can be realized at the system level. That’s why we have set our sights on a bold new target: a 20x improvement in rack-scale energy efficiency for AI training and inference by 2030, from a 2024 base year.4
We believe we can achieve 20x increase in rack-scale energy efficiency for AI training and inference from 2024 by 2030, which AMD estimates exceeds the industry improvement trend from 2018 to 2025 by almost 3x. This reflects performance-per-watt improvements across the entire rack, including CPUs, GPUs, memory, networking, storage and hardware-software co-design, based on our latest designs and roadmap projections. This shift from node to rack is made possible by our rapidly evolving end-to-end AI strategy and is key to scaling datacenter AI in a more sustainable way.
Our 20x goal reflects what we control directly: hardware and system-level design. But we know that even greater delivered AI model efficiency gains will be possible, up to 5x over the goal period, as software developers discover smarter algorithms and continue innovating with lower-precision approaches at current rates. When those factors are included, overall energy efficiency for training a typical AI model could improve by as much as 100x by 2030.5

A 20x rack-scale efficiency improvement at nearly 3x the prior industry rate has major implications. Using training of a typical AI model in 2025 as a benchmark, the gains could enable:6
These projections are based on AMD silicon and system design roadmap and a measurement methodology validated by energy-efficiency expert Dr. Jonathan Koomey.
To make the goal particularly relevant to worldwide energy use, AMD worked with Koomey Analytics to assess available research and data that includes segment-specific datacenter power utilization effectiveness (PUE), including GPU HPC and machine learning (ML) installations. The AMD CPU socket and GPU node power consumptions incorporate segment-specific utilization (active vs. idle) percentages and are multiplied by PUE to determine actual total energy use for calculation of the performance per watt.
The energy consumption baseline uses the same industry energy per operation improvement rates as were observed from 2015-2020, with this rate of change extrapolated to 2025. The AMD goal trend line (Table 1) shows the exponential improvements needed to hit the goal of 30-fold efficiency improvements by 2025. The actual AMD products released (Table 2) are the source of the efficiency improvements shown for AMD goal status in Table 1.
The measure of energy per operation improvement in each segment from 2020-2025 is weighted by the projected worldwide volumes (as per IDC - Q1 2021 Tracker Hyperion - Q4 2020 Tracker, Hyperion HPC Market Analysis, April ’21). Translating these volumes to the ML training and HPC markets results in node volumes as per Table 3 below. These volumes are then multiplied by the Typical Energy Consumption (TEC) of the respective computing segment in 2025 (Table 4) to arrive at a meaningful aggregate metric of actual energy usage improvement worldwide.
Table 1: Summary efficiency data projected to 2025
|
2020 |
2021 |
2022 |
2023 |
2024 |
2025 |
Goal Trend Line |
1.00 |
1.97 |
3.98 |
7.70 |
15.20 |
30.00 |
AMD Goal Status (energy-weighted performance / watt) |
1.00 |
3.90 |
6.79 |
13.49 |
28.29 |
37.85 |
Table 2: AMD Products
2020 |
2021 |
2022 |
2023 |
2024 |
2025 |
EPYC Gen 1 CPU + M50 GPU |
EPYC Gen 2 CPU + MI100 GPU |
EPYC Gen 3 CPU + MI250 GPU |
MI300A APU (4th Gen AMD EPYC™ CPU with AMD CDNA™ 3 Compute Units) |
EPYC Gen 5 CPU + MI300X GPU |
EPYC Gen 5 CPU + MI355X GPU |
*AMD Products are supported by the latest software, including AMD ROCm.
Table 3: Volume Projections (millions/yr)
|
2020 |
2021 |
2022 |
2023 |
2024 |
2025 |
HPC GPU nodes sold |
0.05 |
0.06 |
0.07 |
0.09 |
0.10 |
0.12 |
ML GPU nodes sold |
0.09 |
0.10 |
0.12 |
0.14 |
0.17 |
0.20 |
Table 4: Base case 2025 electricity consumption of products sold in that year, for weighting efficiency indices (TWh/year)
|
2025 |
Base HPC |
4.49 |
Base ML |
29.79 |
Total Base |
34.28 |
* Estimated values for 2025 on worldwide energy use are updated annually as HPC and ML compute node capabilities evolve from our original outlook, including with the growth of AI increasing the weighting for ML performance.
| FLOPS | HBM BW | Scale-up BW | |
| Training | 70.0% | 10.0% | 20.0% |
| Inference | 45.0% | 32.5% | 22.5% |