Rebuilding Agentic AI from First Principles for AMD GPU - Together with Moonshot AI
Jul 21, 2026

The serving stack that powers today's chatbots was built for a workload that is rapidly being replaced. As AI shifts from chat to agentic applications, the assumptions that stack was built on quietly break and patching them one by one is not enough. Working together with the Moonshot AI team, AMD went back to first principles and rebuilt the agentic serving stack from the ground up on AMD Instinct™ GPUs.
Agentic coding, the kind of workload driven by tools like Claude Code, has exploded in token consumption. These sessions are long and multi-turn, their context grows linearly with every turn, they spend much of their wall-clock time between tool calls rather than waiting on a human, and they spawn short-lived subagents that arrive in bursts. The economics of serving them are dominated not by raw compute but by the KV cache: how much of it you can reuse, where it lives when it no longer fits in HBM, and whether the scheduler even knows.
This post describes what agentic workloads actually demand, the end-to-end solution AMD and Moonshot AI built to serve them on AMD GPU, the KV-cache-and-scheduling core at its heart , our in-house UMBP; the concrete optimizations that make it fast, and how we validated that it stays correct.
TL;DR
- Agentic coding is cache-dominated and bursty: context grows linearly with turns, KV-reuse rooflines are extreme, turns wait on tool calls (so p90 end-to-end latency, not TTFT, is what matters), and short-lived subagents create KV-cache bursts.
- We built an end-to-end agentic serving solution together with Moonshot AI — Kimi K2.6 on SGLang + MoRI + UMBP + AITER + ROCm, on AMD Instinct™ MI355X.
- At its core is UMBP (Unified Memory & Bandwidth Pool): a scheduler-aware, multi-tier KV cache (engine HBM → host DRAM → UMBP pool → SSD) that turns cache placement into a cost model the router can act on — not just "who has the prefix" but "who can serve it fastest." e.g. A shareable L3 plus loadback prefetch delivers up to 3.2X smaller p99 TTFT and +7.7% total-token throughput at essentially unchanged cumulative hit rate.
- Full-stack optimizations layered on top: scheduler-aware multi-tier KV caching, loadback prefetch with a zero-CU SDMA restore, incremental P→D KV transfer, delta tokenization (DeltaTok), and intra-turn tool↔engine overlap.
- Evaluated in two parts: performance on a custom agentic-coding dataset built on ProgramBench, and accuracy via Kimi Vendor Verifier (KVV / K2VV) — the performance wins come with no accuracy tax.
What Agentic Applications Demand
To rebuild a stack from first principles you first have to be honest about the workload. Agentic coding traffic has a precise, recognizable shape, and every one of its characteristics maps to a chat-era assumption that no longer holds:
Agentic characteristic |
The chat-era assumption it breaks |
Multi-turn sessions with context that grows linearly with turn count |
Prefill is a one-time cost - false; context balloons toward the HBM ceiling every turn |
Extremely high theoretical KV-cache hit-rate rooflines |
Recompute-everything is fine - false; the entire win is in reuse |
Many short gaps between tool calls |
Latency ≈ TTFT/interactivity - false; turns wait on tools, not humans |
KV-cache bursts from short-lived subagents |
Traffic is steady - false; subagent fan-out arrives in spikes |
Working set that outgrows HBM |
The cache fits in GPU memory - false; it must be offloaded across tiers and stay routable |
Two consequences follow directly, and they shape everything downstream.
First, the right latency metric changes. In the age of agents, most turns are not waiting for a human but for a tool-use call, so the specific split between TTFT and wall time during decode matters far less than it did for chat. The objective we optimize for is therefore token throughput (tok/s/chip) and TCO per million tokens against p90 end-to-end latency, not TTFT or interactivity in isolation.
Second, KV-cache offloading becomes a first-class lever, not an afterthought. Once the working set outgrows HBM, the cache spills to CPU DRAM today (and NVMe tomorrow), under realistic capacity limits - usable KV offload is bounded to a few TB of CPU DRAM per server, proportional to the GPUs in use, and that (substantial) DDR5 cost has to be carried in the TCO. So the question is no longer whether to offload, but how to do it cheaply, correctly, and in a way the scheduler can reason about.
That last point is the crux. When a prefix falls out of every engine's HBM but still lives somewhere, host DRAM on one node, an SSD on another, the value it represents is only realized if the system can find it and fetch it faster than recomputing it. In the chat-era stack, the scheduler is blind to all of this: KV offload backends are passive byte stores, and everything about where the cache lives, how hot it is, and what it costs to fetch is invisible to the one layer that needs it most.
So the core challenge of agentic serving is this: the KV cache no longer fits in HBM, offload is mandatory, and the scheduler is blind to where the cache actually lives ; which tier, which node, at what fetch cost. Closing that gap is what the rest of this post is about.
Kimi K2.6 introduction
Those characteristics are not hypothetical; they are what a frontier agentic model produces the moment it is put to work, and the model we put to work here is Kimi K2.6.
Kimi K2.6 possesses stronger and more stable long-term code writing capabilities, significantly improved instruction compliance and self-correction capabilities, and the ability to handle more complex software engineering tasks. It also significantly enhances the autonomous execution capabilities of the Agent. It features a native multimodal architecture that supports text, image, and video input, thinking and non-thinking modes, and dialogue and Agent tasks.
Seen from the serving side, each of those strengths is also a source of the pressure just described, the long-horizon sessions that push context past HBM, the autonomous Agent execution that gates every turn on a tool call, the multi-turn dialogue whose KV must stay reusable. K2.6 is therefore both the reason the chat-era stack breaks and the yardstick any replacement has to meet: it is the model we serve end to end in this post, and the one whose accuracy we hold fixed while rebuilding everything beneath it. The rest of this post is that rebuild, beginning with the end-to-end stack we designed around it.
An End-to-End Agentic Stack, Built Together with Moonshot AI
Rather than bolt a cache onto an existing chat server, AMD and Moonshot AI co-designed a single, end-to-end solution around the workload described above. It runs Kimi K2.6 on SGLang and the AMD ROCm platform, with MoRI providing the communication and memory fabric, on AMD Instinct™ MI355X. Figure 1 shows how the pieces fit together.
Image Zoom
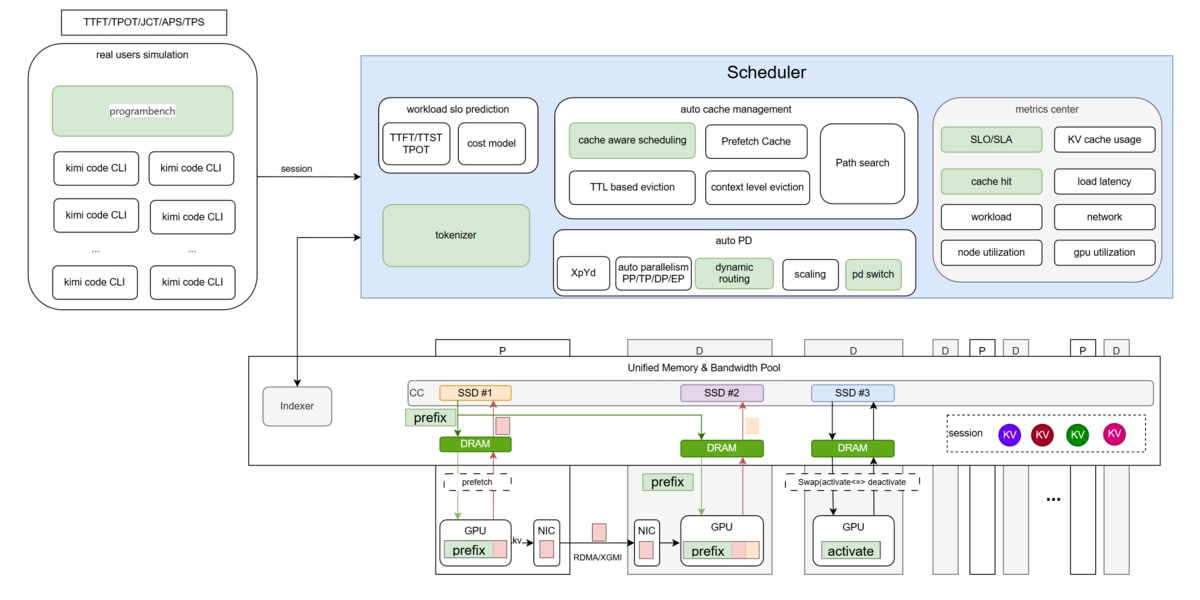
The diagram has three layers:
- Benchmark client (top left). Many concurrent Kimi Code CLI sessions, driven by our ProgramBench-derived agentic workload, emit real agentic-coding traffic and the metrics we care about - TTFT, TPOT, JCT (job/task completion time), APS, TPS, and open a session to the scheduler.
- Scheduler (center). The brain of the stack. It fuses four responsibilities: workload SLO prediction (latency prediction plus the cost model), auto cache management (cache-aware scheduling, prefetch, TTL- and context-level eviction, path search), auto PD (XpYd prefill/decode ratios, auto parallelism across PP/TP/DP/EP, scaling, dynamic routing), and a metrics center that feeds all of them - SLO/SLA, KV-cache usage, cache-hit rate, load latency, node/GPU utilization, network, and workload.
- Unified Memory & Bandwidth Pool (bottom). The KV substrate - UMBP. Prefill (P) and decode (D) nodes are disaggregated over a multi-tier pool (GPU HBM → DRAM → SSD) in which prefixes are prefetched, migrated across nodes over RDMA/XGMI, and swapped between active and deactivated states, so a session's KV stays routable wherever it currently lives.
That layering is deliberate. Every characteristic of agentic traffic pointed to the same conclusion: the decisive resource is not FLOPs but the KV cache- how much of the reuse roofline you can actually capture, where the cache lives once it spills out of HBM, and whether the scheduler can route to it faster than recomputing it. So of everything in Figure 1, the block that determines whether the whole solution wins or loses is the scheduler together with the Unified Memory & Bandwidth Pool - KV cache offload and request scheduling. That is where we invested most, and it is where our in-house component ,UMBP, lives. The next section zooms into it.
The Core: Scheduler-Aware Multi-Tier KV Caching with UMBP
Why existing KV offload isn't enough
Most L3 KV-cache backends today — file stores, Mooncake, NIXL, HF3FS, and the like - are passive byte stores. The serving engine pushes pages down when HBM is full and pulls them back up on a hit; the backend faithfully stores and returns bytes and does nothing else. Everything the system learns along the way, which node holds which prefix, how hot each block is, how fast a given replica can actually return it — stays locked inside the storage layer, invisible to the scheduler.
For chat traffic that is tolerable. For agentic traffic it is exactly backwards, because the scheduler is the layer that most needs that information. When a subagent arrives whose prefix has fallen out of HBM, the right decision , recompute locally, or fetch from the node that holds it, and if fetch, from which replica, depends entirely on placement, temperature, and fetch cost. A passive byte store can answer "does this prefix exist somewhere?" but not "who can serve it fastest?" , and for a cache-dominated workload, that second question is the one that sets your p90 end-to-end latency.
What is UMBP
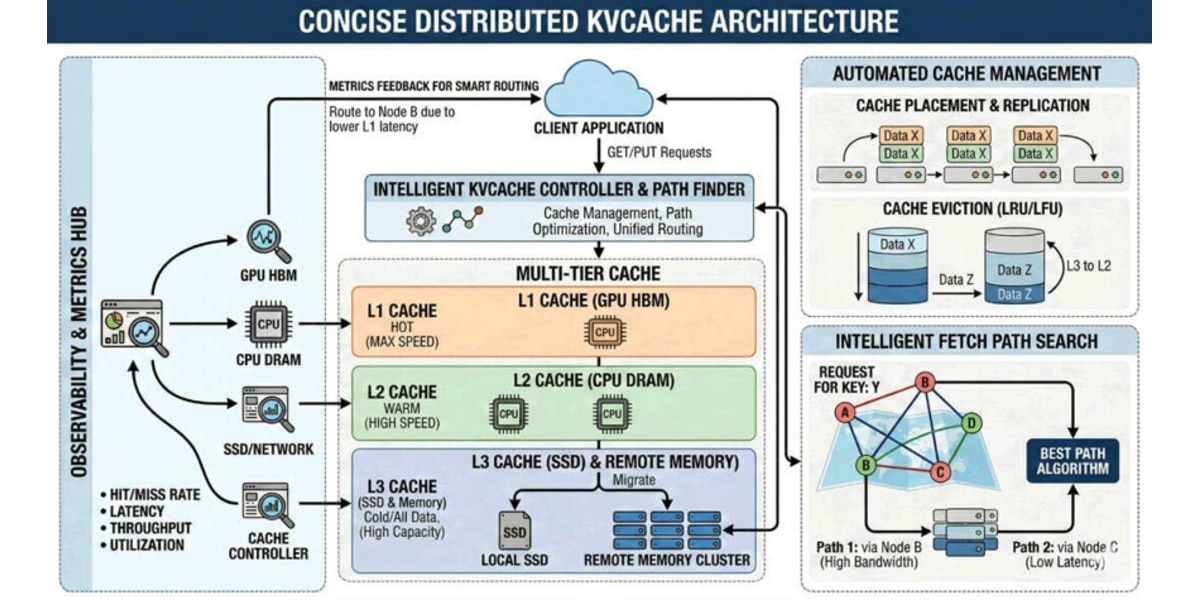
UMBP (Unified Memory & Bandwidth Pool) is the tiered-storage, distributed KV component of AMD's MoRI library. We integrated it into SGLang two ways at once: as a HiCache L3 storage backend and as a KV-event feed the scheduler can consult. It manages a single logical cache spanning every tier — engine HBM → host DRAM → the UMBP DRAM pool → SSD — and, crucially, it exposes what it knows to the layer that makes routing decisions.
It differs from a passive byte store in four ways - the four pillars of the design.
- Pillar 1 - Scheduler-friendly, co-designed with the router (mori-sched). The UMBP master is a cluster-wide KV placement directory covering all tiers. Beyond "who has the prefix," it exposes per-key historical access counts, routing hit counters, last-access time, per-node capacity and utilization, access-bandwidth histograms, and RPC latency. With those signals the router can build a real cost model — routing not to whoever happens to hold a prefix, but to whoever can serve it fastest.
- Pillar 2 - Customizable cache-management policy. Offload (put-routing), load (get-routing), eviction, and — planned — replication are pluggable strategy interfaces, all reading the same rich metrics. Cache management becomes a developer surface instead of a hard-coded LRU, so policies can be tuned to the revisit patterns of a specific agentic workload.
- Pillar 3 - Agent-aware hints (WIP). TTL, session pinning, and priority hints flow from the serving API, through HiCache, down into UMBP. Agentic workloads often know their revisit patterns — a subagent's parent context will be needed again shortly — and these hints let the workload shape cache retention explicitly instead of leaving it to a generic eviction heuristic.
- Pillar 4 - AMD hardware affinity by design. The data plane is co-designed with AMD GPU/CPU/NIC capabilities — IBGDA and SDMA transports, GPU-Direct Storage, and GPU-initiated NVMe — so moving a page between tiers or across nodes costs as little as the hardware allows.
The closed loop
The two integrations; the L3 data path (UMBPStore ↔ client, zero-copy RDMA) and the KV-event feed (KV events ↔ master ↔ router), are decoupled, so each is useful alone. Together they close a loop:
The engine reports placement → the master indexes it and accumulates access history → the router routes on the cost model (Pillar 1) → routing decisions train the hit history → placement, eviction, and replication policies consume that history (Pillar 2) → agent hints override it where the workload knows better (Pillar 3), all riding on a data plane co-designed with AMD hardware (Pillar 4).
The payoff, in one line: a prefix that has fallen out of every engine's HBM but survives in the UMBP pool stays routable, and is fetched from the nearest replica over RDMA instead of being recomputed. That is precisely the win the high agentic hit-rate roofline promises, and passive byte stores leave on the table.
How it wires into SGLang
The integration reuses SGLang's existing machinery rather than reinventing it:
Concern |
SGLang touchpoint |
Backing MoRI call |
L3 byte store |
UMBPStore (zero-copy v1 HiCache interface) |
BatchGet / BatchPut / BatchExistsConsecutive |
L2 host buffer |
UMBPHostTensorAllocator hook |
host KV tensor registration |
KV-event feed |
KVEventsSubscriber ← existing ZmqEventPublisher (no engine changes) |
master external-KV index |
Routing |
mori-sched umbp_cache_aware policy |
master query per request |
A few design choices matter for agentic serving specifically. The L3 path issues pointer-based BatchGet/BatchPut directly against the host KV page buffers with no intermediate copy, and the L2 host allocator hands out a hugepage-backed, NUMA-bound, prefaulted tensor so the KV buffer can be registered once for RDMA — one Put or Get becomes exactly one RDMA op. In distributed mode, ranks join a master-led pool, duplicate puts across DP ranks are deduped by the master, and connection reuse keeps thousands of concurrent requests — the subagent bursts described earlier — from exhausting ports. The backend registers as mori and is selected with --hicache-storage-backend mori; the whole integration is flag-gated, so a build without UMBP is unaffected.
This data plane already runs daily in our PD-disaggregation benchmarks. The scheduler-side cost model, pluggable policies, and agent hints are landing in phases — today umbp_cache_aware routes on prefix match, and the full Pillar-1 cost model is the next step. (Design and integration: sgl-project/sglang#25377.)
Key Optimizations
UMBP sets up the cache and the routing; a series of full-stack optimizations turn that architecture into throughput. Each of the following was motivated directly by a property of agentic traffic, not chat.
Loadback prefetch and a zero-CU restore path
In agentic serving the prefix cache is the dominant latency lever: context grows every turn and is re-entered constantly, so the KV-reuse roofline is extreme and a prefix-cache hit is the common case, not the exception. A hit trades storage for compute — the prefix's KV is fetched from where it was offloaded rather than recomputed — which is what collapses TTFT on a long session. But that only pays off if the restore is hidden: on a hit the KV sits one or more tiers down (host DRAM, the local UMBP pool, or a remote node) and must be loaded back into HBM before the engine can use it. A loadback on the critical path merely swaps a recompute for a stall, so the goal is to overlap the loadback with the model forward — the KV lands in HBM before it is needed, and the hit costs effectively nothing. Two mechanisms make that possible.
Prefetch up the tiers, including remote KV. The cost model knows where a session's prefix lives and anticipates its re-entry, so UMBP prefetches the KV up the hierarchy ahead of need. The source depends on the hit: a prefix in this node's lower tier (local L3) is staged up into HBM; one on another node (remote L3) is pulled across the network into the local host tier — caching remote KV locally, so later turns use the memory bus. Remote L3 matters most when the node holding the prefix is saturated: the scheduler routes the request to a less-loaded node and fetches the prefix over RDMA, avoiding both a queue behind that node's load and a recompute, which lowers TTFT. Either way, the prefix is resident in HBM before the engine needs it.
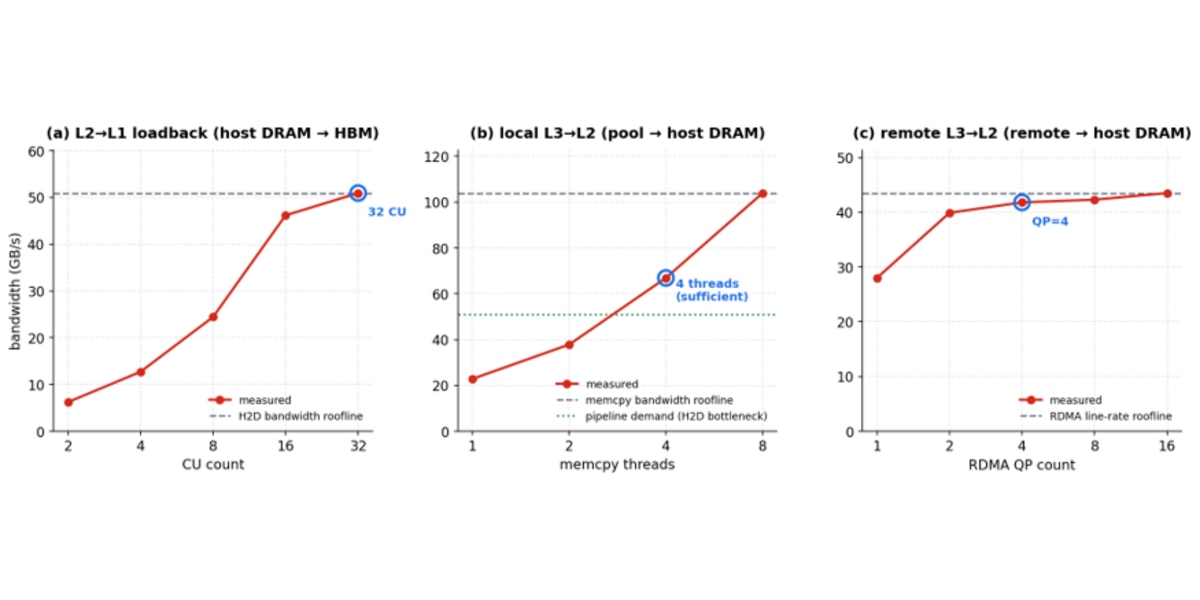
A zero-CU loadback. The final restore hop, L2→L1 (host DRAM → HBM), can be issued by a compute kernel or the SDMA engine. Kernel-copy bandwidth scales with CU count and approaches the H2D roofline (~51 GB/s) at 32 CUs, but consumes CUs that prefill needs. The SDMA copy engine does it at zero CU cost: it reaches the same H2D roofline and returns those CUs to prefill, so restore no longer contends with prefill for compute.
Each stage of the restore pipeline runs near the hardware roofline of its transport (Figure 3). L2→L1 reaches the H2D bandwidth (~51 GB/s). The local L3→L2 host memory copy, optimized with multi-threading and non-temporal (NT) store instructions, reaches ~66 GB/s at 4 threads — above the pipeline's H2D-bound demand (~51 GB/s), so more threads add no end-to-end gain. The remote L3→L2 path is zero-copy, aggregating the workload and distributing it across multiple NICs and QPs, so host RDMA saturates near QP=4 (~42 GB/s) at its effective line rate. Each upstream stage is provisioned only to the bandwidth the H2D restore — the sole bottleneck — requires, and that bottleneck is fully overlapped with the model forward by the zero-CU loadback.
The restore path meets its theoretical performance target rather than merely approaching it: the binding L2→L1 H2D stage runs at its roofline (~51 GB/s), and remote RDMA reaches ~96% of line rate (41.8 of 43.5 GB/s). The only stage below its ceiling — local memcpy, capable of ~104 GB/s — is capped at 4 threads because that bandwidth already meets the pipeline's demand: a capacity choice, not a performance shortfall.
Loadback restore. The measurements below are unit tests of the KV restore pipeline, one stage per panel.
Incremental KV transfer across the prefill/decode split
PD disaggregation puts prefill and decode on separate nodes, so before decode can run a turn, that turn's KV has to cross the wire from P to D. For chat that is a one-time handoff. For an agentic session it is the linear-growth problem again, now on the network: context grows every turn, and the naive handoff re-ships the entire prefix each round — turn N pays to transfer everything turns 0…N-1 already sent. On a long coding session that redundant re-transfer comes to dominate the P→D path, and it lands directly on TTFT, because decode cannot begin until the KV has arrived.
But decode already holds almost all of it. When the decode side keeps a radix cache across turns, the KV pages it received on turn N-1 are still resident on turn N — the very prefix prefill is about to re-send. So the fix is the same unchanged-prefix-reuse principle UMBP applies to offload and DeltaTok applies to tokens, applied one more place — the P→D transfer: prefill sends only the pages beyond what decode already holds.
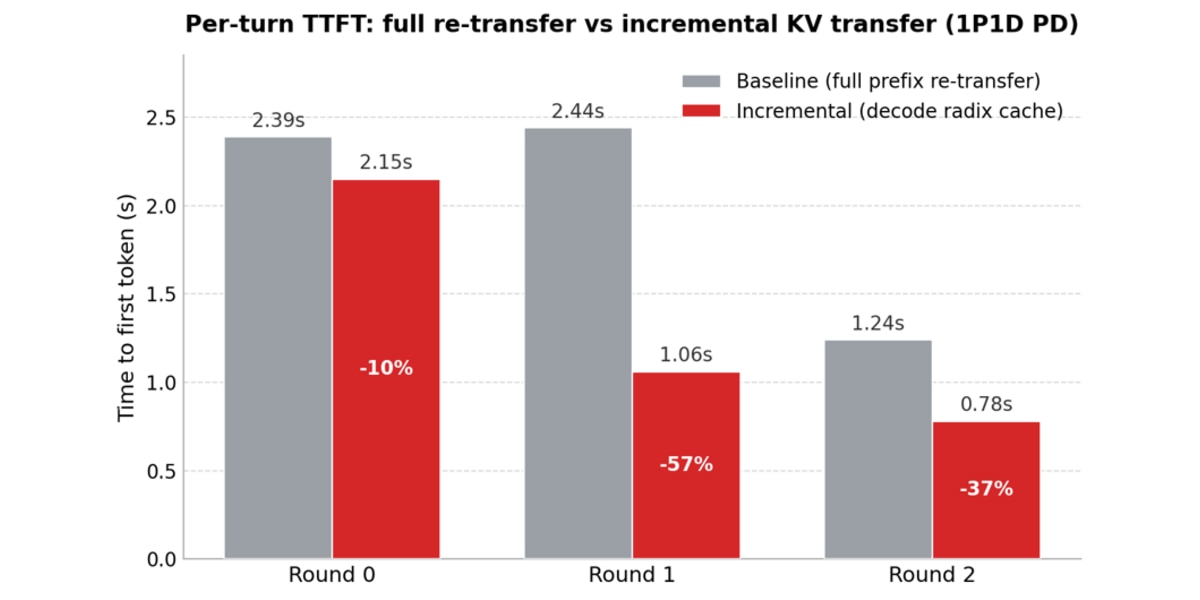
The win is two-fold. The obvious half is latency: the saving grows with the session, exactly where agentic traffic lives — the later the turn, the larger the already-cached prefix that no longer crosses the wire. On a two-node 1P1D micro-benchmark it is the later, prefix-heavy turns that fall the most — round 1 TTFT drops from 2.44 s to 1.06 s and round 2 from 1.24 s to 0.78 s — for ~21% lower average TTFT across the first three rounds (Figure 4). The quieter half is bandwidth: the bytes never sent are bytes that never leave the prefill GPU's NIC, so incremental transfer frees prefill-side NIC egress bandwidth — a resource one prefill shares across every decode it feeds. Reclaiming it lets that link carry more concurrent P→D handoffs (and the subagent bursts that ride them) before it saturates, so the benefit compounds under load rather than accruing to a single request [6].
Incremental KV transfer. The measurements below are a 1P1D PD-disaggregation micro-benchmark on two AMD Instinct™ MI355X nodes (DeepSeek-R1 MXFP4, DP=8 / TP=8, mori transfer backend), comparing per-turn TTFT with decode-side radix caching off (baseline, full prefix re-transfer every turn) versus on (incremental — only the delta beyond the cached prefix crosses the wire).
Tokenizer layer: delta tokenization with DeltaTok
Linear context growth has a second, quieter cost - on the CPU, not the GPU. Tokenization sits at the very front of every request (tokenize → block-hash → cache lookup), and the chat-era path re-tokenizes the entire conversation every turn: O(N) in context length, growing without bound as a session accumulates turns. UMBP keeps the KV for that history routable; DeltaTok does the symmetric thing for the tokens themselves.
DeltaTok is an agent-oriented, AMD Zen 5–accelerated Rust tokenizer in the UMBP family that acts as SGLang's tokenizer-of-record — token ids feed the engine directly. Its core lever is delta encoding: it derives turn boundaries once from the chat template (probe-rendering it, then snapping each boundary to the nearest special-token hard boundary so segment concatenation stays BPE-safe), caches each segment, and on the next turn re-encodes only the newly added turn - O(1), independent of context length, reusing the unchanged prefix. The engine keeps the reused prefix's tokens (their KV is already resident) and appends only the new ones, byte-for-byte identical to a full re-encode. It is the same unchanged-prefix reuse principle UMBP applies to KV, applied one layer up.
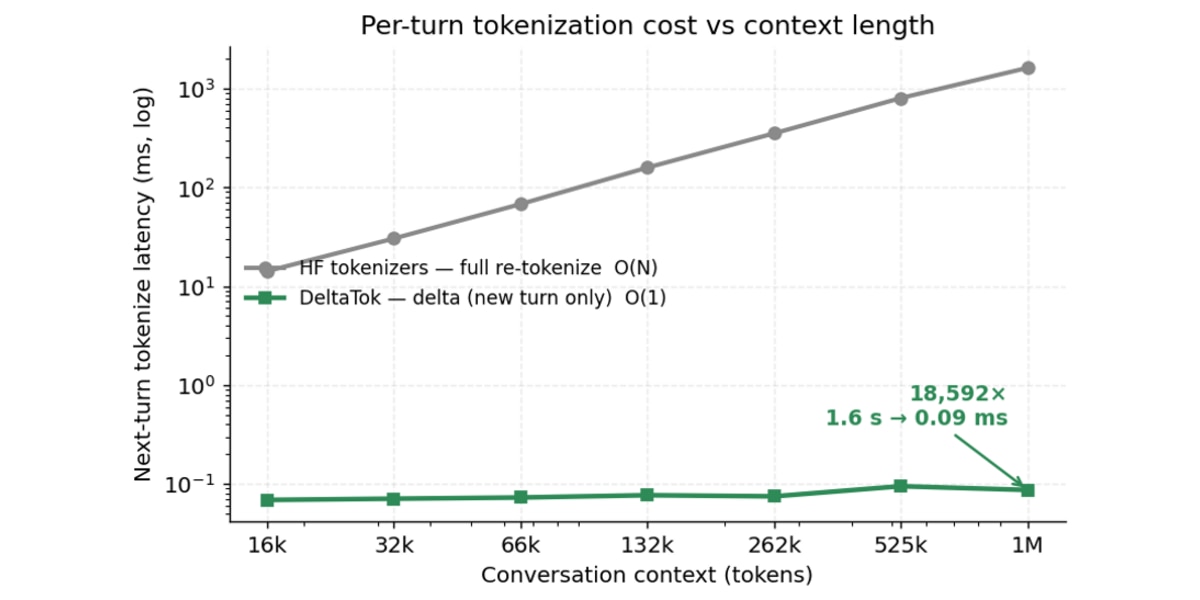
The payoff lands exactly where agentic sessions live, long, many-turn context. At a 1M-token context a full re-tokenize costs ~1.7s per turn; DeltaTok's next-turn delta is ~0.09 ms, flat regardless of context length. And it is verified byte-exact against HuggingFace AutoTokenizer across the Kimi-series and other production tokenizers — the speedup carries no accuracy cost, consistent with Part 2 below.
The figure below is measured on AMD EPYC 9575F (Zen 5), DeltaTok vs the HuggingFace tokenizers.
CPU (tool) ↔ GPU (inference engine) overlap
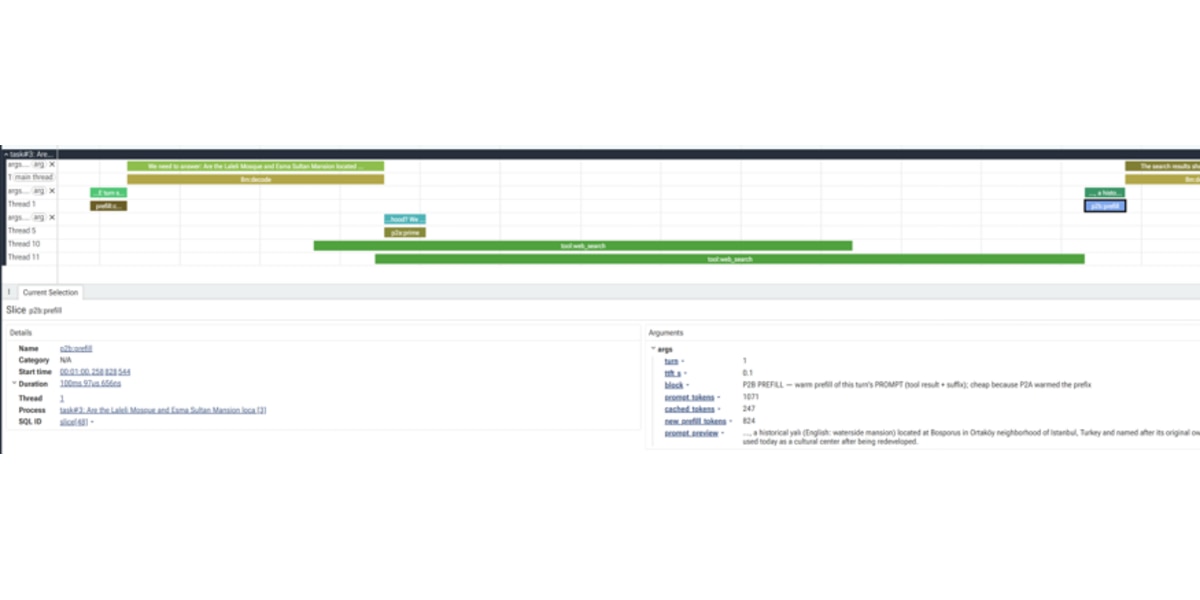
The optimizations above reuse KV across requests; a tool-based agent also leaves an idle window within a single turn. A turn is a dependency chain — decode a tool call → run the tool → prefill the next turn on its result — in which the tool gap (sandbox round-trips, web search, MCP, sub-agent calls) is usually the longest segment, often close to a second, and the accelerator sits idle across it. It is a scheduling problem, not a model one: the overlaps below reorder only the schedule, leaving outputs unchanged.
Concurrent tool fan-out dispatches a turn's independent, side-effect-free calls at once, cutting its tool wait from Σ(tᵢ) to max(tᵢ). Streaming mid-decode dispatch parses the tool_calls stream during decode and starts each call the instant its arguments close, so the tool overlaps the decode tail rather than following it. Cross-turn prefix residency and prefill overlap keeps the session's shared prompt prefix resident through the tool gap — pinned so contention cannot evict the very blocks the next turn will reuse — so that turn prefills only the new, tool-dependent suffix and hits cache on the prefix instead of recomputing it. It is the request-side counterpart to UMBP's cross-request reuse, realized by the engine's session-scoped radix cache: keyed by session_id, held across the gap by lock-ref / priority eviction.
All three preserve semantics: only independent tools — reads, and writes to disjoint state — are dispatched early or in parallel, while tools that depend on a prior result or would conflict run serially and in order, and results are reassembled by their original index, so the context is bit-identical to the serial loop. The net effect: the tool round-trip is overlapped with the current turn's decode, and the next turn re-prefixes against the resident KV instead of recomputing it — keeping the engine busy where it would otherwise stall (see figure).
Image Zoom
Evaluation
We evaluate the solution in two parts, because two things must both hold: the system has to perform, and the answers have to stay correct. All results use Kimi K2.6 on native SGLang, on AMD Instinct™ MI355X.
Part 1 - Performance on a ProgramBench-derived agentic dataset
To drive the system with a genuinely agentic workload we built a custom dataset on top of ProgramBench. ProgramBench is a cleanroom software-engineering benchmark: an agent is given only a compiled executable and its usage documentation and must architect and implement an entire codebase that reproduces the original's behavior, judged by hundreds of thousands of hidden behavioral tests across its 200 tasks. That makes it a near-ideal stress test for agentic serving — long multi-turn sessions, heavy tool use, and deep context growth — so we sample and adapt its tasks into replayable agentic-coding traces.
How we generate traffic: We drive every ProgramBench task with the real Kimi CLI, not a synthetic HTTP replayer, using SwarmPressure — our own harness for pointing agent CLIs at a cluster under test. It launches one isolated kimi CLI container per task, seeded with that task's binary and docs, and lets the agent solve it end to end — reading docs, writing code, and iterating compile.sh against real build/test feedback — against our own cluster instead of a hosted API. So context growth, tool-call gaps, and turn count all come from the agent's own decisions, not a scripted trace, which is what makes this traffic close to real-world agentic load.
How sessions are rotated: Real users step away and come back to a conversation whose cache has gone cold, so a served cluster always holds a mix of hot, warm, and cold state — a benchmark keeping the same sessions hot throughout would report an unrealistically warm cache. So we hold concurrency fixed but keep only a fraction of those sessions active at any instant: each active session runs for a bounded quantum, then is evicted and replaced by one from the inactive pool, leaving its KV to age through the tiers as an idle user's would until it is resumed later.
This is what first-call measures — a resumed session's next call, whose prefix has had time to fall out of the local warm cache and must come from a lower or remote tier, or be recomputed. Rotation generates those calls at a realistic rate, which is why first-call hit rate, not the cumulative figure, is what moves in both experiments below.
Running those traces, the question we put to the data is whether UMBP converts the reuse that agentic traffic makes available into serving wins. The two experiments below answer the cache-behavior half of that question, and they share one measurement vocabulary: KV-cache hit rate, split into first-call (a session's cold or resumed call, where the prefix must come from somewhere other than the local warm cache) and later-call (the warm continuation of a round); TTFT across its distribution (avg/p50/p90/p99) and split the same two ways; and total token throughput, reported as uplift over each experiment's L2-only baseline.
That split is the whole point. Cumulative hit rate turns out to be nearly the same in every config we tested, so it hides the effect entirely — what a shareable L3 changes is which calls hit, and the first-call/later-call decomposition is what makes that visible and connects it to the TTFT tail. Both experiments run at concurrency 128 and vary the cache-tier configuration; they differ in why L3 helps. Experiment 1 runs a capacity-starved deployment — one prefill instance, 96 GB of host DRAM per rank — where L3 wins by buying effective capacity a replicated L2 can't. Experiment 2 removes that excuse: twice the DRAM (192 GB per rank) and twice the prefill instances, enough cache that the L2-only baseline is already healthy. L3 still wins there, for a different reason — capacity you can't reach is capacity you don't have.
Experiment 1 — L3 effect and the loadback prefetch optimization at high concurrency
This is a single fixed-concurrency snapshot, taken at the high end where a pure-L2 budget is under the most pressure. We hold the workload fixed and vary only the cache-tier configuration across three runs.
Experimental setup: Fixed across all three configs: Kimi-K2.6-MXFP4 on a 1P2D topology, driven by 128 concurrent programbench agentic sessions. Each node has 8× AMD Instinct™ MI355X, 8× AMD Pensando™ Pollara 400G NICs, and a total 1TB DRAM budget. The only variable is the cache-tier configuration per rank:
Config |
L2 (per rank) |
L3 (per rank) |
Loadback prefetch optimization |
A — L2-only baseline |
96 GB |
— (none) |
— |
B — +L3, opt off |
64 GB |
32 GB |
not applied |
C — +L3, opt on |
64 GB |
32 GB |
applied |
Why these knobs. MLA+TP replicates the L2 cache across TP ranks, so a pure-L2 budget effectively shrinks as TP width grows, while L3 doesn't pay that tax. Under a fixed DRAM budget, carving part of L2 into L3 therefore buys more effective capacity. Once L3 is in play, the restore path (L3→L2 then L2→L1) always runs asynchronously behind the model forward; the loadback prefetch optimization makes both hops more efficient, so that overlap is fast enough to hide the restore entirely. Configs A→B isolate splitting part of L2 into L3 (at equal total DRAM); B→C isolate turning on the loadback prefetch optimization.
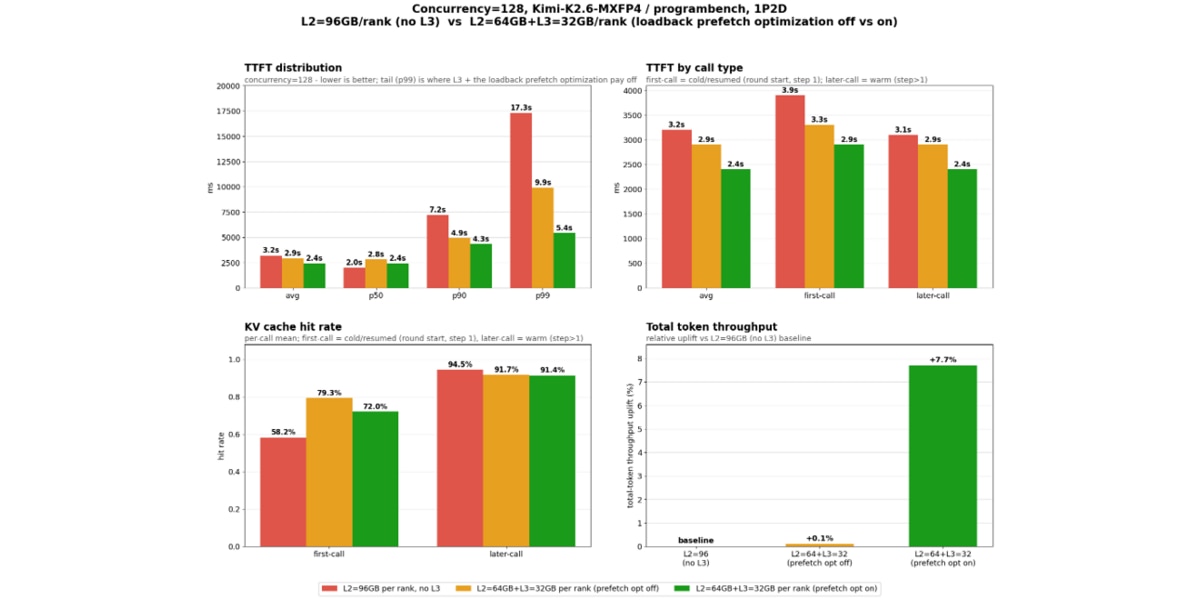
Analysis - two effects stack (all numbers from Figure 7)
- Splitting part of L2 into L3 (A→B) barely moves cumulative hit rate (88.5% → 88.3%) but redistributes the TTFT curve. It lifts first-call (cold/resumed) hit rate 21 points (58.2% → 79.3%), converting the capacity-starved cold misses — which recompute the prefix and form the fat tail — into L3 hits, so the tail collapses (p99 17.3s → 9.9s, p90 7.2s → 4.9s). The median rises (p50 2.0s → 2.8s): L2 shrank 96 → 64GB, and the un-optimized restore — though still async — isn't fast enough to be fully hidden behind the forward, so part of the extra L3→L2 hop leaks onto the critical path. Net, a small deterministic median cost buys away catastrophic tail risk (avg 3.2s → 2.9s) — but throughput stays flat (+0.1%), the reshaped hits not yet converted to tokens/s.
- Turning on the loadback prefetch optimization (B→C) eases first-call hit to 72.0% but makes the L3→L2 and L2→L1 restore efficient enough to be fully hidden behind the model forward, where B's slower restore still leaked onto the critical path. Every percentile improves at once (p50 2.8s → 2.4s, p90 4.9s → 4.3s, p99 9.9s → 5.4s) and throughput jumps 7.7% — and because the L2→L1 hop runs over the zero-CU SDMA engine, hiding the restore also returns CUs to prefill instead of spending them on the copy. (The 2.4s median is still just above pure-L2's 2.0s — the split L2 is smaller and overlap isn't perfect — but C wins on avg, tail, and throughput.)
- End to end (A→C), TTFT improves across the whole distribution (avg 3.2s → 2.4s, p90 7.2s → 4.3s, p99 17.3s → 5.4s — 3.2× better at the tail), while cumulative hit rate actually drops 1 point (88.5% → 87.5%). The gain isn't concentrated in cold starts alone: first-call TTFT drops 3.9s → 2.9s and later-call drops 3.1s → 2.4s — similar relative improvement for both.
Summary: At high concurrency, L3 doesn't need to win on aggregate hit rate to pay off — it reshapes where hits land (favoring cold/resumed first-call over warm later-call), and turning on the loadback prefetch optimization converts that reshaped hit distribution into a 3.2× better TTFT tail and 7.7% higher total-token throughput — absorbing capacity pressure that a replicated-only L2 budget can't.
Experiment 2 - request migration when the cache is already big enough
Experiment 1's win could be dismissed as an artifact of a tight memory budget: give the baseline enough DRAM, the objection goes, and L3 has nothing left to buy. This experiment is built to answer that. It runs the same concurrency on a deliberately over-provisioned deployment — 192 GB of host DRAM per rank instead of 96 GB, across two prefill instances instead of one, and it shows in the baseline, which is no longer capacity-starved: with L2 alone, cumulative hit rate is already 95.0% and first-call hit rate 82.2%, against 88.5% and 58.2% in Experiment 1.
Capacity is therefore not the binding constraint here. Locality is. Sessions are forcibly migrated between prefill workers, and the question becomes whether a prefix stays reachable once it and the worker that built it part ways — because a worker-local L2, however large, cannot answer a request that has moved.
Experimental setup: Fixed across both configs: Kimi-K2.6-MXFP4 on a 2P1D topology, 128 concurrent programbench agentic sessions with 64 active at any instant (a 2-minute quantum per active burst). Each session is pinned to one prefill worker, all starting on worker 0; a deliberate cold-start pile-up, and that pin rotates to the other worker once the session's context has grown ≥256 tokens, checked at every round start and every resume. Since a round grows context by far more than that, in practice every continuation lands on the worker that did not build the prefix, carrying the whole accumulated prefix as the miss — a rolling deploy, an autoscale event, or a lost sticky session. The variable is the cache-tier configuration:
Config |
Prefill L2 (per rank) |
Prefill L3 (per rank) |
Decode host cache |
A - L2-only baseline |
192 GB |
- (none) |
- (device tier only) |
B - +L3 |
160 GB |
32 GB |
L2 64 GB + L3 128 GB, offload on |
Why these knobs: Prefill DRAM is held equal at 192 GB per rank — twice Experiment 1's budget — so B buys its L3 by carving 32 GB out of an already-ample L2, not by spending more memory. That isolates the one property under test: L2 is worker-local, so a migrated session's prefix is unreachable from its new worker and must be recomputed no matter how much of it there is; L3 is shareable, so the same prefix is fetched over RDMA instead. Note that B also enables the decode-side host cache, so this pair compares L3 enabled across the deployment against a purely worker-local L2, rather than isolating the prefill split alone.
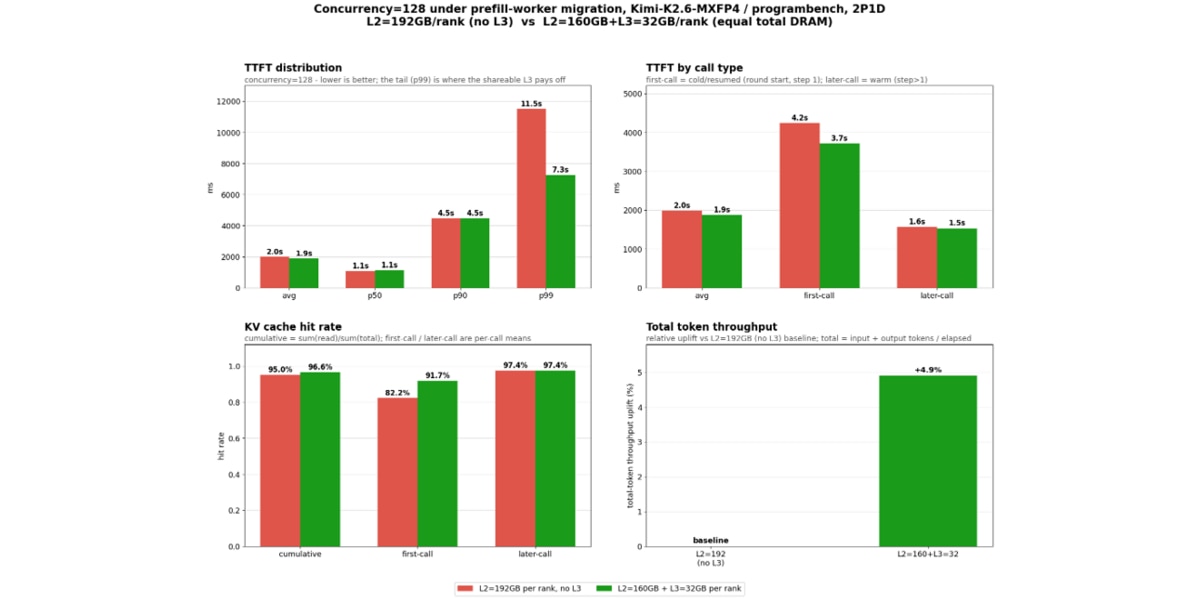
Analysis (all numbers from Figure 8).
- Cumulative hit rate barely moves — 95.0% → 96.6%, a 1.5-point gain that looks like noise and, on its own, would suggest L3 does nothing. It doesn't, because later-calls are 84% of all calls and they drown out the effect.
- The split shows where the effect actually is. Later-call hit rate is identical to the decimal (97.4% both) — L3 changes nothing for a warm continuation, exactly as expected. First-call hit rate moves 9.5 points (82.2% → 91.7%): the migrated round start, which under L2-only finds nothing on its new worker and recomputes the prefix, instead finds it in the shareable L3.
- That redistribution lands on the tail. TTFT p99 falls 1.6× (11.5s → 7.3s) and first-call TTFT drops 12.4% (4.24s → 3.71s), while later-call TTFT is flat (1.56s → 1.53s) — the improvement is concentrated exactly where the hit-rate gain is. As in Experiment 1, the median pays a small deterministic cost (p50 1.08s → 1.14s) because L2 is 32 GB smaller, and p90 is unchanged (4.46s → 4.47s).
- Total token throughput rises 4.9%, with output tokens up 6.5% — the recomputes that L3 absorbs return prefill capacity to serving new work.
Summary: Even with the cache sized generously enough that the L2-only baseline is already healthy, migration breaks the pin between a session and the worker holding its prefix — and a worker-local L2 has no answer, however large: the prefix is unreachable and must be recomputed. A shareable L3 carved from that same DRAM catches it, converting a 9.5-point first-call hit-rate gain into a 1.6x smaller TTFT tail and 4.9% more total token throughput. Experiment 1 showed L3 buying capacity; this shows it buying reach — and cumulative hit rate, the number most benchmarks report, moves 1.5 points and hides the whole effect.
Part 2 - Accuracy with Kimi Vendor Verifier (KVV / K2VV)
Performance means nothing if the rebuilt engineering layer quietly degrades quality. To rule that out we use Kimi Vendor Verifier (KVV) - Moonshot's open-source suite for verifying that an inference implementation is accurate, built precisely to separate "model capability defects" from "engineering implementation deviations." Our rebuild changes exactly the engineering layer — KV offload across tiers, cost-model routing, FP4 quantization, speculative decoding — so KVV is the right instrument.
It is also pointedly relevant. K2VV, its tool-calling variant, measures tool-trigger consistency (tool_call_f1) and JSON-schema accuracy — exactly what agentic reliability rests on — while KVV's vision benchmarks exercise the full multimodal path end to end. We ran the official harness (inspect-ai based, with the repo's required per-benchmark parameters) for Kimi-K2.6-MXFP4 served through the same stack this post describes — a 2P1D mori-scheduler disaggregated deployment on AMD Instinct™ MI355X (gfx950, ROCm 7.2) with UMBP as the HiCache backend — to show parity with the official Kimi reference.
K2VV tool calling — schema accuracy reaches parity with the official API. On the K2VV tool-call suite (non-think, official K2.6 reference dataset of 2,000 requests), the baseline deployment already clears the passing bar, and enabling constrained tool-call decoding (xgrammar grammar backend + SGLANG_TOOL_STRICT_LEVEL=1) lifts JSON-schema accuracy to a perfect 100% — eliminating all 54 malformed-argument cases — while trigger-similarity tool_call_f1 stays at the official ~84% level:
Run |
Constrained decoding |
tool_call_f1 |
Schema accuracy |
Schema errors |
A - baseline |
off |
84.97% |
94.73% (970/1024) |
54 |
B - constrained |
xgrammar + strict=1 |
84.12% |
100.00% (1047/1047) |
0 |
Official Kimi-K2.6 API |
reference |
~84.0% |
100% (1012/1012) |
0 |
Both runs clear K2VV's deployment bar (tool_call_f1 ≥ 80%). The reading is clean: constraining the structure of a tool call makes every triggered call schema-valid (matching the official API) without changing whether the model triggers one, so F1 is flat by construction, the ~84% level, with the small run-to-run drift the K2VV README itself notes. Constrained decoding is off by default in the launch scripts, so it never perturbs the performance benchmarks in Part 1.
KVV vision benchmarks - the multimodal path works end to end. Every vision benchmark passes with healthy accuracy through the mori-sched router, in both non-thinking and thinking modes:
Benchmark |
Mode |
Samples |
Accuracy |
OCRBench |
Non-Thinking |
1000 |
0.922 |
OCRBench |
Thinking |
1000 |
0.911 |
MMMU Pro Vision (10-choice) |
Non-Thinking |
1730 |
0.738 |
MMMU Pro Vision (10-choice) |
Thinking |
1730 |
0.782 |
The pattern is the expected one: thinking mode helps on the harder multimodal-reasoning task (MMMU Pro Vision, 0.782 vs 0.738) and is neutral on OCR (0.911 vs 0.922) — confirming the vision path is faithful through disaggregation and offload.
The result we are after is simple to state: the performance wins of Part 1 come with no accuracy tax — the rebuilt stack is faster and cheaper and verifiably correct, at parity with Moonshot's official reference on both the multimodal and tool-calling paths.
Looking Ahead
This post is a first turn, not a finish line. The next round of work runs along three lines:
- Co-designing for Kimi K3: Our optimization focus shifts to the next-generation Kimi K3. Each model generation pushes the agentic envelope further — longer horizons, deeper and more parallel tool use, larger context — and with it every pressure this post is built around. We intend to co-design the serving stack with K3 from the outset, so the KV-cache-and-scheduling core evolves with the model rather than chasing it.
- Bringing agentic serving to more engines - ATOM, SGLang, vLLM: The UMBP tiered cache, cost-model routing, and AMD-native data movement are engine-agnostic by design. We are integrating them into AMD's in-house ATOM inference engine for tuned first-party performance on AMD Instinct™ GPUs, while deepening agentic support in the open-source SGLang and vLLM engines — so these primitives reach production deployments and the wider community wherever they already run.
- Completing the UMBP roadmap: On the scheduler side, promoting umbp_cache_aware from prefix match to the full cost model, wiring in pluggable placement/eviction/replication policies, and threading agent-aware hints end to end are all in progress. On the storage side, NVMe as a fourth tier and GPU-initiated NVMe access extend the reuse roofline further down the memory hierarchy. And the same zero-compute-overhead data movement that serves inference carries over to agentic post-training and reinforcement learning, where tool-use rollouts have their own cache and communication patterns.
Summary
Agentic applications broke the assumptions the chat-era serving stack was built on: context grows linearly with every turn, the KV-reuse roofline is enormous, turns wait on tool calls rather than humans, and short-lived subagents arrive in bursts. Together, those properties make the KV cache; not compute - the resource that decides cost and latency, and they force the cache out of HBM and across tiers where the scheduler can no longer see it.
Working together with the Kimi team, AMD rebuilt the stack from first principles for this workload on AMD Instinct™ MI355X: Kimi K2.6 on SGLang and ROCm, with a KV-cache-and-scheduling core, UMBP - that makes offloaded cache routable and turns placement into a cost model the router acts on. Full-stack optimizations convert that architecture into throughput, and Kimi Vendor Verifier confirms the wins come without an accuracy tax. The cache no longer falls off a cliff at the edge of HBM, and the scheduler is no longer blind to where it lives.
Acknowledgements
AMD AIG team, Moonshot AI team, SGLang core team and community contributors
References
- SGLang: Fast Serving Framework for Large Language and Vision Models
- MoRI: Modular RDMA Interface for AMD GPUs
- UMBP integration RFC / PR
- ProgramBench | BenchLM
- Kimi Vendor Verifier (KVV / K2VV) | Moonshot AI
- Incremental KV transfer with decode radix cache (PD)
- Sutradhara: An Orchestrator-Engine Co-design for Tool-based Agentic Inference | arXiv
Footnotes
Endnotes
Testing conducted by internal AMD Performance Labs as of July 18, 2026
System configuration for AMD Instinct™ MI355X benchmark:
- GPU: 8× AMD Instinct™ MI355X per node
- Host CPU: AMD EPYC™ processors
- Network: AMD AINIC (ionic) RDMA, 8 NICs per node
- Software: SGLang v0.5.15+, AITER, MoRI, ROCm 7.2
- Model: amd/Kimi-K2.6-MXFP4
Server manufacturers may vary configurations, yielding different results. Performance may vary based on configuration, software, and the use of the latest drivers and optimizations.
Footnotes
Endnotes
Testing conducted by internal AMD Performance Labs as of July 18, 2026
System configuration for AMD Instinct™ MI355X benchmark:
- GPU: 8× AMD Instinct™ MI355X per node
- Host CPU: AMD EPYC™ processors
- Network: AMD AINIC (ionic) RDMA, 8 NICs per node
- Software: SGLang v0.5.15+, AITER, MoRI, ROCm 7.2
- Model: amd/Kimi-K2.6-MXFP4
Server manufacturers may vary configurations, yielding different results. Performance may vary based on configuration, software, and the use of the latest drivers and optimizations.


Related Blogs
-
Kimi K3 on AMD Instinct GPUs with TokenSpeed
TokenSpeed delivers fast, agentic LLM inference on AMD Instinct™ MI355X GPUs, with optimized kernels and leading Kimi K3 performance.
October 09, 2026
-
scikit workloads with AOCL Data Analytics
Accelerate supported scikit-learn workloads with AOCL-Data Analytics while keeping your existing Python code and familiar scikit-learn APIs.
October 09, 2026
-
MangoBoost Delivers Open AI Models Powered by AMD
Mango Inference a serverless inference service providing production-ready access to open models powered by AMD Instinct™ GPUs and AMD ROCm™ software
October 09, 2026
-
Pre-Training Hybrid LLMs from Scratch in Primus on AMD Instinct™ GPUs — ROCm Blogs
Pre-train hybrid LLMs mixing MLA attention with Gated DeltaNet, Kimi Delta Attention and Mamba2 mixers on AMD Instinct MI355X GPUs, with open recipes.
October 07, 2026
-
DI Series: Serving Kimi-K3 MXFP4 Wide-EP Disaggregated on AMD Instinct MI300X and MI325X — ROCm Blogs
Learn how to serve a 1.4 TiB Kimi-K3 MXFP4 mixture-of-experts model disaggregated across AMD Instinct MI300X and MI325X GPUs.
October 07, 2026
-
AMD Instinct MI455X vs MI355X: A Technical Look at the Advancing AI 2026 Inference Numbers — ROCm Blogs
Explore the MI455X vs MI355X inference numbers from Advancing AI 2026, and learn how each benchmark was measured and what it really means.
October 07, 2026
-
Completing the GPU Performance Picture: Understanding TAF Alongside Peak FLOPs and MAF — ROCm Blogs
Learn how Typical Attained FLOPs complements Peak FLOPs and Max-Achievable FLOPs, including the methodology and MI325X results
October 05, 2026
-
How Agentic AI Is Expanding the Role of the DPU
As agentic AI drives more stateful workloads, DPUs are becoming critical for networking, storage, KV-cache management, and infrastructure efficiency.
October 05, 2026