Efficiency Meets Value: AMD EPYC™ 4005 Series Processors
Oct 03, 2025

In my recent blog, Another Generation of Leadership: AMD EPYC 9005 vs. Intel Xeon 6, I explored how the 5th Gen AMD EPYC™ 9005 Series Processors have set a new standard for innovation and performance across diverse workloads. Now, let’s turn our attention to the AMD EPYC™ 4005 Series—engineered specifically for the entry-level segment where cost sensitivity and power efficiency are paramount.
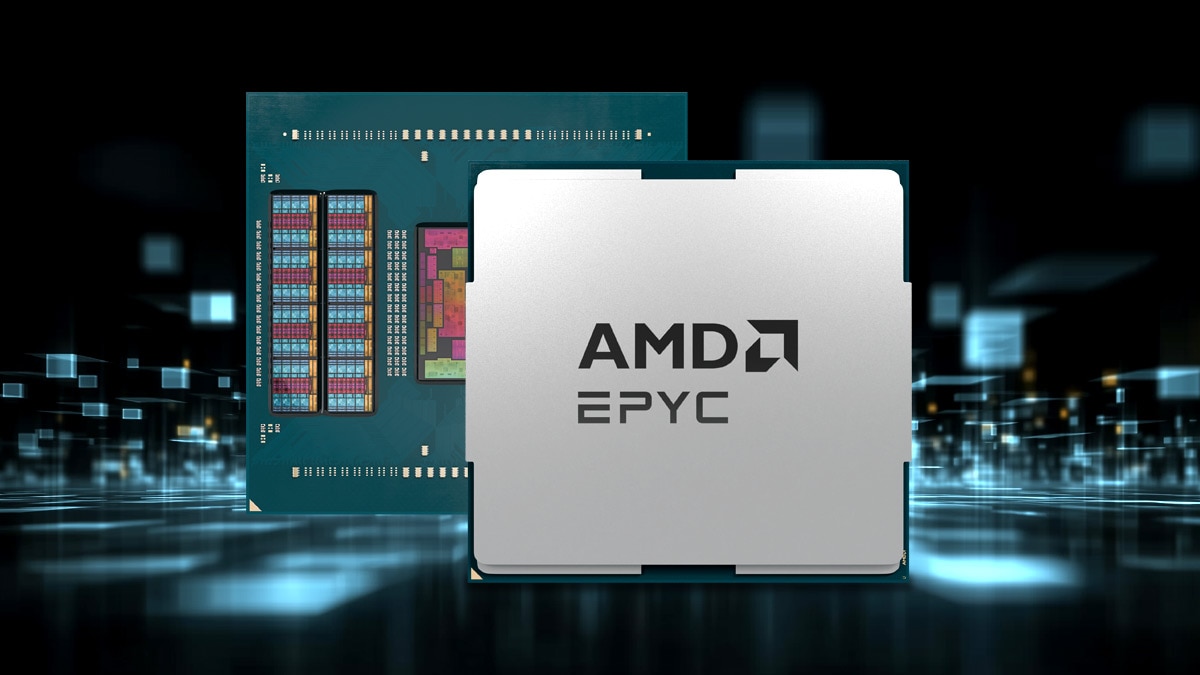
The EPYC 4005 Series brings EPYC-class capabilities to environments with constrained thermal envelopes and tighter budgets, without sacrificing essential performance. Built on the proven AM5 socket, these processors offer broad deployment flexibility and impressive boost frequencies up to 5.7 GHz. Configurations range from 6 to 16 “Zen 5” cores across up to two Core Complex Dies (CCDs), supporting 12 to 32 threads via Simultaneous Multi-Threading (SMT). Each CCD includes up to 32 MB of shared L3 cache, totaling 64 MB per processor. For cache-intensive workloads, the 16-core EPYC 4585PX leverages AMD’s 3D V-Cache™ die stacking to double the L3 cache to 128 MB.
With a compelling price-to-performance ratio, the EPYC 4005 Series is ideal for hosting providers and small businesses managing critical workloads on lean budgets. Whether you're running general-purpose servers, building software, or deploying AI, these processors deliver efficient, scalable performance tailored to your needs.
Key Use Cases for AMD EPYC™ 4005 Series
- General Computing: Ideal for small businesses managing everyday tasks such as web hosting, email, messaging, and local operations — all with reliable performance and low power consumption.
- Hosting Services: Hosting providers can rely on EPYC 4005 for scalable, energy-efficient infrastructure that delivers consistent performance while keeping costs down.
- E-Commerce: EPYC 4005 provides a powerful, scalable, and cost-effective platform for online retailers — ensuring fast, reliable performance to meet on-demand traffic and customer expectations.
- Software Development: Developers benefit from strong multi-threaded performance that accelerates compile times and boosts productivity — ideal for small tech teams operating within budget constraints.
Striking the Right Balance: Performance Meets Affordability
For small and medium-sized businesses, choosing the right processor means balancing performance with cost — and processor pricing plays a major role in that decision.
Here’s a look at the published 1Ku pricing as of May 13, 2025:
- 16-core AMD EPYC™ 4565P: $589 (~$36.81 per core)
- 8-core Intel® Xeon® 6369P*: $606 (~$75.75 per core)
This means the cost per core of the EPYC 4565P is approximately 49% lower than its Intel counterpart.
This highlights the exceptional value of the AMD EPYC™ 4005 Series — delivering enterprise-grade performance at a significantly lower cost, making it a smart investment for businesses looking to optimize their server infrastructure without overspending.
General-Purpose Computing
SPEC CPU® 2017 is a widely recognized industry-standard benchmark used to evaluate the performance of general-purpose workloads. It measures compute-intensive tasks by stressing processors, memory subsystems, and compilers across a variety of systems. The benchmark includes 43 tests grouped into four suites; this blog focuses on the SPECrate® 2017 Integer suite.
As shown in Figure 1, a single-socket system powered by the 16-core AMD EPYC™ 4565P delivers approximately 1.95× higher SPECrate® 2017_int_rate_base performance compared to a single-socket system based on the 8-core Intel® Xeon® 6369P.[2] Additionally, the EPYC 4565P-powered server offers a 2.01× performance-per-CPU-dollar advantage.[3]

Figure 1: SPECrate® 2017 int_rate_base
Java-Based Applications
The SPECjbb® 2015 benchmark is designed to evaluate server-side Java® application performance by simulating a corporate IT environment that handles point-of-sale transactions, online activities, and data mining tasks. Due to the widespread use of Java, this benchmark is highly relevant to JVM vendors, hardware manufacturers, Java developers, researchers, and academic institutions. SPECjbb® 2015 assesses performance using two key metrics: max-jOPS, which measures maximum throughput without strict response time constraints, and critical-jOPS, which evaluates throughput under response time limitations to reflect real-world production environments.
According to our internal testing, a single-socket 16-core AMD EPYC™ 4565P powered system achieves approximately 1.78× the performance of a single-socket 8-core Intel® Xeon® 6369P system on the SPECjbb® 2015 MultiJVM max-jOPS metric, representing maximum capacity throughput. On the critical-jOPS metric, which reflects p99 response time-bounded throughput, the EPYC 4565P system delivers roughly 1.93× the performance of the same Intel processor. Additionally, the AMD system offers up to a 1.99× performance-per-CPU-dollar advantage, underscoring its value in production environments where both performance and cost efficiency are critical.[4]

Figure 2: SPECjbb® 2015 MultiJVM max-jOPS and critical-jOPS
Relational Databases
The TPC Benchmark C™ is an online transaction processing (OLTP) benchmark that defines a set of functional requirements applicable to any transaction processing system, regardless of hardware or operating system. To simulate this workload, the HammerDB benchmark tool was used to develop and generate the TPROC-C workload. While this open-source workload is derived from the TPC-C Benchmark™ Standard, it is not directly comparable to published TPC-C™ results, as it does not comply with the official benchmark standard. Nevertheless, HammerDB TPROC-C remains a valuable tool for quickly assessing database system performance, comparing different database platforms, and optimizing system configurations.
Figure 3 highlights our internal testing, where a single-socket 16-core AMD EPYC™ 4565P powered system achieved approximately 2.20× the MySQL TPROC-C TPM performance of a single-socket 8-core Intel® Xeon® 6369P based server. Additionally, the EPYC-powered system delivered around 2.26× the performance-per-CPU-dollar advantage over its Intel counterpart.[5]

Figure 3: MySQL™ TPROC-C Transactions Per Minute
Media Processing
Media processing has become an increasingly common edge workload, driven by the rising demand for high-quality video content. FFmpeg, a versatile multimedia framework, supports a wide range of functions including encoding, decoding, transcoding, streaming, filtering, and playback across both legacy and modern formats and standards.
Figure 4 highlights our internal testing, where a single-socket 16-core AMD EPYC™ 4565P powered system achieved average FFmpeg encoding speed-ups of approximately 2.51× compared to a system powered by the Intel® Xeon® 6369P processor. Notably, this performance uplift comes at a processor cost roughly 3% lower than the Intel counterpart, underscoring the EPYC 4565P’s efficiency and value in media-intensive workloads. A single-socket 16-core AMD EPYC 4565P system achieves average FFmpeg encode processor performance/CPU dollar uplifts of ~2.59x compared to the same Intel system.[6]

Figure 4: FFmpeg encoding performance
Conclusion
The AMD EPYC™ 4005 Series redefines expectations for entry-level server processors by combining advanced features, efficient architecture, and outstanding value. Built on the proven Zen 5 core and AM5 platform, these processors deliver the performance and scalability required to support modern workloads across industries—without the premium price tag.
Whether it's general computing, hosting, e-commerce, or software development, the EPYC 4005 Series empowers small and medium-sized businesses to scale confidently, backed by enterprise-grade technology. With a significantly lower cost-per-core compared to competing solutions, AMD continues to democratize high-performance computing, making it accessible to innovators at every level.
For organizations focused on optimizing performance, efficiency, and budget, the EPYC 4005 Series stands out as a smart, future-ready investment.
Endnotes
1. EPYC-18: Max boost for AMD EPYC processors is the maximum frequency achievable by any single core on the processor under normal operating conditions for server systems.
2. E4K-034: As of 8/27/2025, highest SPECrate® 2017_int_rate_base results: - 1P AMD EPYC 4565P (16C), Score 205, https://www.spec.org/cpu2017/results/res2025q2/cpu2017-20250419-47594.html, $589 - 1P Intel Xeon 6369P (8C), Score 105, https://www.spec.org/cpu2017/results/res2025q1/cpu2017-20250204-46207.html, $606 Pricing as of 5/13/2025. Intel pricing at https://www.intel.com/content/www/us/en/products/sku/241616/intel-xeon-6369p-processor-24m-cache-3-30-ghz/specifications.html. SPEC® and SPECrate® are registered trademarks of Standard Performance Evaluation Corporation. Learn more at spec.org.
3. E4K-028A: Relative processor performance/$ calculated as relative uplift/(AMD EPYC 4005 1Ku price/Intel Xeon 1Ku price). For the AMD EPYC 4565P vs. Intel Xeon 6369P, this is 1.95/(589/606)=~1.95/~0.97=~2.01x. These results reflect only processor costs at the listed 1Ku prices. Your actual costs may vary widely due to variables such as but not limited to the number of processors purchased and system configuration.
4. E4K-033: SPECjbb(R) 2015 multi-instance max-jOPS and critical jOPS comparisons based on compliant internally tested results as of 08/05/2025. 1P EPYC 4565P production system, 78916 multi-instance max jOPS (133.98 Perf/$), 43590.00 critical jOPS (74.01 Perf/$), 16 cores, $589 CPU $, 2 x 32 GB 5600 Mt/s, NIC I210 Gigabit Network, 1 x 1TB NVMe® BIOS 21.06, SMT=ON, determinism=power, NPS=1, OS Ubuntu 24.04.2 LTS (kernel 6.8.0-57-generic), default OS options (mitigations=off). 1P Intel Xeon 6369P production system, 44390 max jOPS (73.25 Perf/$), 22585 critical jOPS (37.27 Perf/$), 8 cores, $606 CPU $, 2 x 32 GB DDR5 5600, 1G Broadcom NetXtreme BCM5720 Gigabit Network Connection, 1 x 3.84TB NVMe®, BIOS 3.10, Hyperthreading=ON, performance bias, OS Ubuntu 24.04.2 LTS (kernel 6.8.0-60-generic), default OS options (mitigations=off). Results may vary based on factors including but not limited to system configurations, software versions, and BIOS settings. Results are compliant runs for SPECjbb®2015. SPEC® and SPECjbb® are registered trademarks of the Standard Performance Evaluation Corporation. See www.spec.org for more information. Intel prices from ark.intel.com as of 08/05/2025.
5. E4K-031A: AMD Internal Testing as of 07/01/2025 on MySQL TPROC-C workload (SQL Server OLTP Brokerage) estimate based on internal AMD measurements as of 07/01/2025. The HammerDB TPROC-C workload is an open-source workload derived from the TPC-C™ Benchmark Standard and as such is not comparable to published TPC-C results, as the results do not comply with the TPC-C Benchmark Standard. Workload Configs: Workload configs: MySQL 8.0.41, 8 core nodes (Multi-SUT), HammerDB-4.4, duration 5min, 32 v users, warehouses 128, aggregate New Orders Per Minute (NOPM) AMD system configuration: 1P 16c AMD EPYC 4565P CPU (16C) on production system, $589 CPU $, 2 x 32GB DDR5-5600, Intel Corporation I210 Gigabit Network Connection, 1 x 1TB NVMe®, BIOS 21.06, SMT=ON, NPS=1, OS Ubuntu® 24.04.2 LTS (kernel 6.8.0-57-generic), OS options= vm.swappiness=1, vm.dirty_ratio = 40, fs.file-max = 6815744, fs.aio-max-nr = 1048576, mitigations=off, determinism=power, 2469512 TPM (4192.72 TPM/CPU$) Intel system configuration: 1P 8c Intel Xeon 6369P CPU (8C) on production system, $606 CPU $, 2 x32 GB DDR5 5600, 1G Broadcom NetXtreme GCM5720 Gigabit Network Connection, 1 x 3.84TB NVMe®, BIOS 3.10, Hyperthreading=ON, OS Ubuntu 24.04.2 LTS (kernel 6.8.0-60-generic) options= vm.swappiness=1, vm.dirty_ratio = 40, fs.file-max = 6815744, fs.aio-max-nr = 1048576, mitigations=off, performance bias, 1122535 TPM (1852.37 TPM/CPU$) For ~2.20x the TPM and ~2.26x the TPM/CPU $ Results may vary based on factors including but not limited to system configurations, software versions, and BIOS settings. TPC, TPC Benchmark, and TPC-C are trademarks of the Transaction Processing Performance Council. Intel prices from ark.intel.com as of 08/05/2025.
E4K-032A: AMD Internal Testing as of 07/01/2025 on FFmpeg 6.1.1-3ubuntu5 Workload Configs: tearsofsteel-4k.y4m, (size, 172.8 GB, duration (secs) 12:14.2, frames 17620, format Raw y4m, resolution 4096x1714, container y4m, codec Raw, encoder libvpx_vp9). Tears of Steel 4K. © Blender Foundation | Mango.blender.org. AMD system configuration: 1P 16c AMD EPYC 4565P on production system, $589 CPU $, 2 x 32 GB 5600 Mt/s, NIC I210 Gigabit Network, 1 x 1TB NVMe® BIOS 21.06, SMT=ON, determinism=power, NPS=1, OS Ubuntu 24.04.2 LTS (kernel 6.8.0-57-generic), default OS options (mitigations=off). Intel system configuration: 1P 8c Intel Xeon 6369P CPU on production system, $606 CPU $, 2 x 32 GB DDR5 5600 1G Broadcom NetXtreme GCM5720 Gigabit Network Connection, 1 x 3.84TB NVMe®, BIOS 3.10, Hyperthreading=ON, performance bias, OS Ubuntu 24.04.2 LTS (kernel 6.8.0-60-generic), default OS options (mitigations=off). Results: ~2.50x the performance (8 jobs @2 threads/job) and ~2.57x the performance/CPU $ ~2.51x the performance (4 jobs @ 4 threads/job) and ~2.59x the performance/CPU $ ~2.53x the performance (2 jobs @ 8 threads/job) and ~2.60x the performance/CPU $ Results may vary due to factors such as BIOS settings and hardware configurations. Intel prices from ark.intel.com as of 08/05/2025.s


