5th Gen AMD EPYC CPUs : The Engine Behind Google Cloud’s Next Leap
Feb 06, 2026

Industry response to our 5th Gen AMD EPYC™ processors introduced in late 2024, has been phenomenal. We’re deeply grateful to our partners and customers for their continued support. As a result, AMD EPYC now commands over 40% of server CPU market share1—a milestone driven by exceptional performance, energy efficiency, low total cost of ownership, and strong collaboration with cloud and enterprise ecosystem partners.
In my previous blog posts, I explored how our latest generation of processors accelerate performance across enterprise, HPC, and AI workloads. If you missed them, you could find those insights here:
- 5th Gen AMD EPYC Processors Lead Enterprise and Cloud Workloads Forward
- 5th Gen AMD EPYC Processors Elevate HPC and AI Workloads to New Heights
The new 5th Gen EPYC processors deliver significant generational improvements—up to doubling performance in many scenarios. Powered by the new “Zen 5” cores, they offer up to 17% better single-threaded performance on enterprise and cloud workloads2 and scale up to 192 cores per processor, a 50% increase in maximum core count over the previous generation. Memory bandwidth has also advanced, supporting speeds up to 6400 MT/s and up to 8 TB per socket, enabling seamless handling of large, complex workloads. Confidential Computing enhancements now include support for Trusted I/O, allowing devices enabled with the PCI TEE Device Interface Security Protocol (TDISP) to be securely bound to a confidential guest virtual machine.
EPYC in Google Cloud
Since 2019, AMD has collaborated with Google Cloud to expand support across general-purpose, high-performance, and confidential computing instances. In 2025, the collaboration reached a new milestone with the launch of C4D and N4D virtual machines powered by 5th Gen AMD EPYC processors, delivering faster CPU clock speeds, enhanced memory bandwidth, and robust security features. At launch, Google Cloud also introduced its first AMD processor-based bare metal instances, and made Confidential VMs available simultaneously, offering additional options to impact performance and protection. C4D instances support up to 384 vCPUs and up to 3 TB of memory, instances with local SSDs, and advanced networking and storage options — providing customers with flexible, high-performance solutions for demanding workloads. N4D instances support up to 96 vCPUs and 768 GB of DDR5 memory. Google positions C4D as its consistent high performance general-purpose instance series, with premium features such tier 1 networking and the Confidential option, while N4D provides cost efficiency for less performance-sensitive workloads and a custom VM option. Google Cloud made C4D generally available in June 2025 and brought N4D to GA in November of this year.
Workload Performance Characterization
In this blog, I’ll share both generational and competitive performance insights for AMD 5th Gen EPYC CPU-based C4D and N4D instances on Google Cloud. The benchmarks focus on 16 vCPU instance sizes — one of the most widely used VM configurations for general-purpose computing. We evaluated a range of workloads, including server-side Java®, relational databases, web serving, in-memory analytics and media processing.
To provide meaningful comparisons, we measured how C4D and N4D perform relative to the previous-generation C3D instances, as well as against C4 instances powered by Intel’s 5th Gen Xeon® processors. The analysis includes both raw workload performance and performance-per-dollar metrics on 16 vCPU standard (4:1 GB to vCPU, no local SSD) instances.
1. General Purpose Computing
The SPEC CPU® 2017 benchmark is a highly regarded, regulated, and audited industry standard for assessing compute-intensive workloads. It rigorously tests processors, memory subsystems, and compilers across a variety of systems, providing valuable insights into performance and efficiency. This benchmark serves as a critical tool for evaluating the capabilities of modern computing architectures. This blog focuses on estimated SPECrate® 2017 Integer performance.
As shown in Figure 1, C4D instances deliver approximately 1.27x the estimated SPECrate® 2017 Integer performance, and N4D instances deliver 1.29x the estimated performance compared to the prior generation C3D. C4D instances deliver an estimated 1.20x and N4D instances deliver an estimated 1.23x the integer performance compared to C4 standard instances based on Intel 5th Gen Xeon architecture. When evaluating performance-per-dollar, C4D demonstrates around 1.29x (est.) and N4D demonstrates around 1.43x (est.) the efficiency of C4.
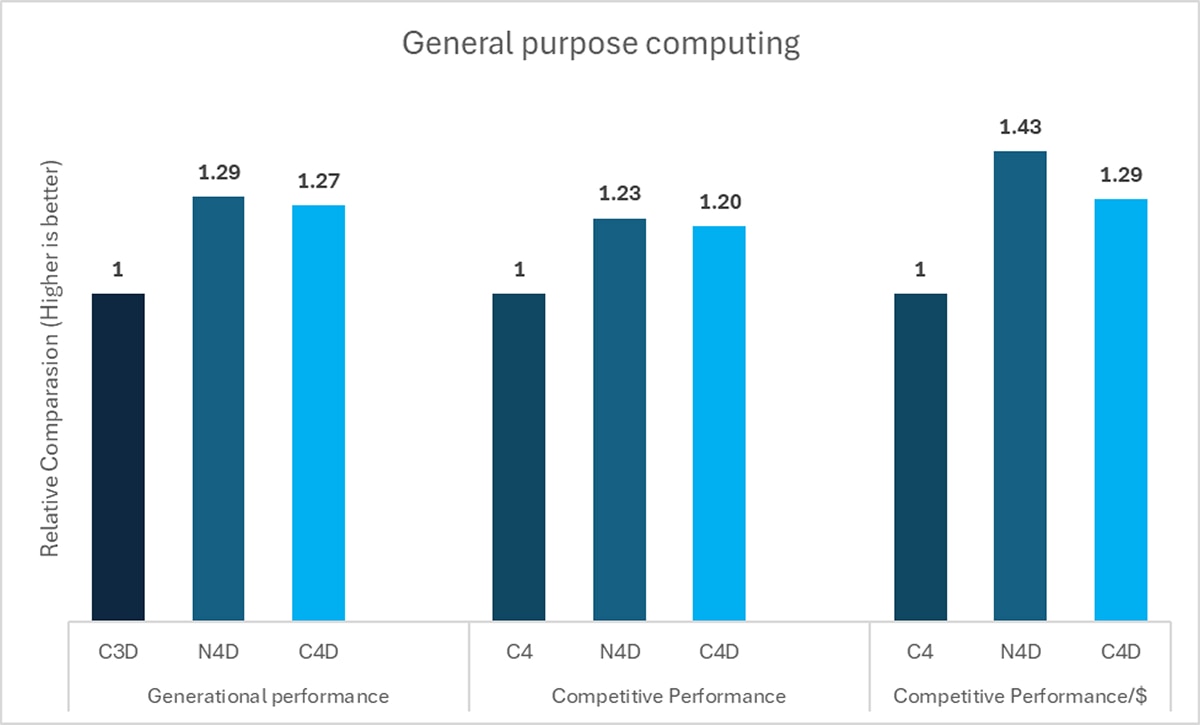
Figure 1: Estimated SPECrate® 2017 Integer performance3-6
2. Server-side Java
Java is a widely adopted programming language, renowned for its portability and versatility, which allows developers to build applications that run reliably across a broad range of platforms. For this analysis, we used a server-side benchmark — a well-established tool for evaluating Java application performance in a simulated enterprise IT environment. This benchmark models workloads such as point-of-sale transactions, online commerce, and data-mining operations, making it highly relevant to JVM vendors, hardware manufacturers, developers, and researchers.
One of the key metrics from server-side benchmarking is max-jOPS (Java operations per second), which measures the maximum throughput of Java-based e-commerce transactions and reflects the system’s peak processing capacity. As shown in Figure 2, C4D instances deliver approximately 1.24x and N4D instances deliver approximately 1.18x the Java multi-instance max-jOPS compared to C3D. C4D instances deliver approximately 1.22x and N4D instances deliver approximately 1.16x the Java multi-instance max-jOPS compared to C4 instances based on Intel 5th Gen Xeon architecture. When evaluating performance-per-dollar, C4D demonstrates around 1.31x and N4D demonstrates around 1.36x the efficiency of C4.
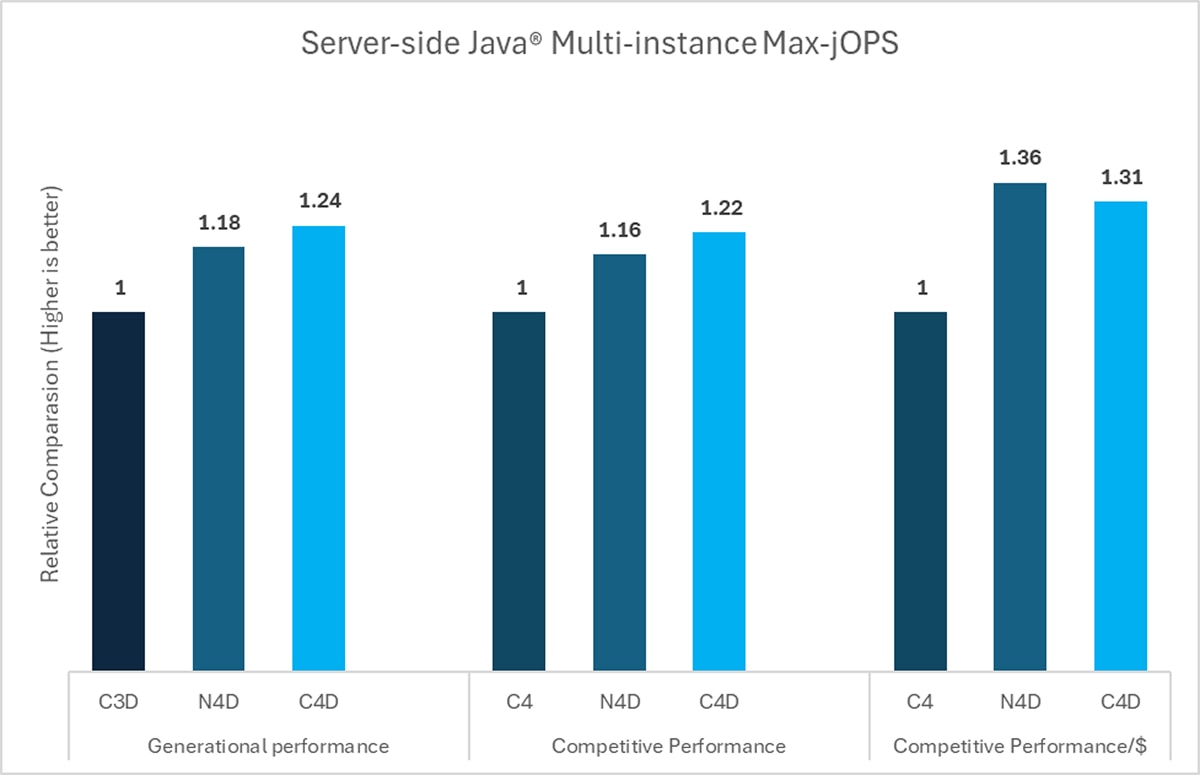
Figure 2: Server-side Java® multi-instance max-jOPS7-10
3. Relational Databases
MySQL™ is one of the most widely used open-source database management systems, trusted globally across enterprise and cloud-native environments for both decision support and transactional workloads. For this evaluation, we used the TPROC-C benchmark, which is derived from the industry-standard TPC-C™, designed to measure performance in transaction processing systems.11
Figure 3 presents the results of this benchmark, showing that C4D instances deliver approximately 1.57x and N4D instances deliver approximately 1.53x the MySQL TPROC-C throughput compared to C3D. C4D instances deliver approximately 1.53x and N4D instances deliver approximately 1.48x the MySQL TPROC-C throughput compared to C4. When looking at performance-per-dollar, C4D achieves around 1.63x and N4D achieves around 1.73x the efficiency of C4.
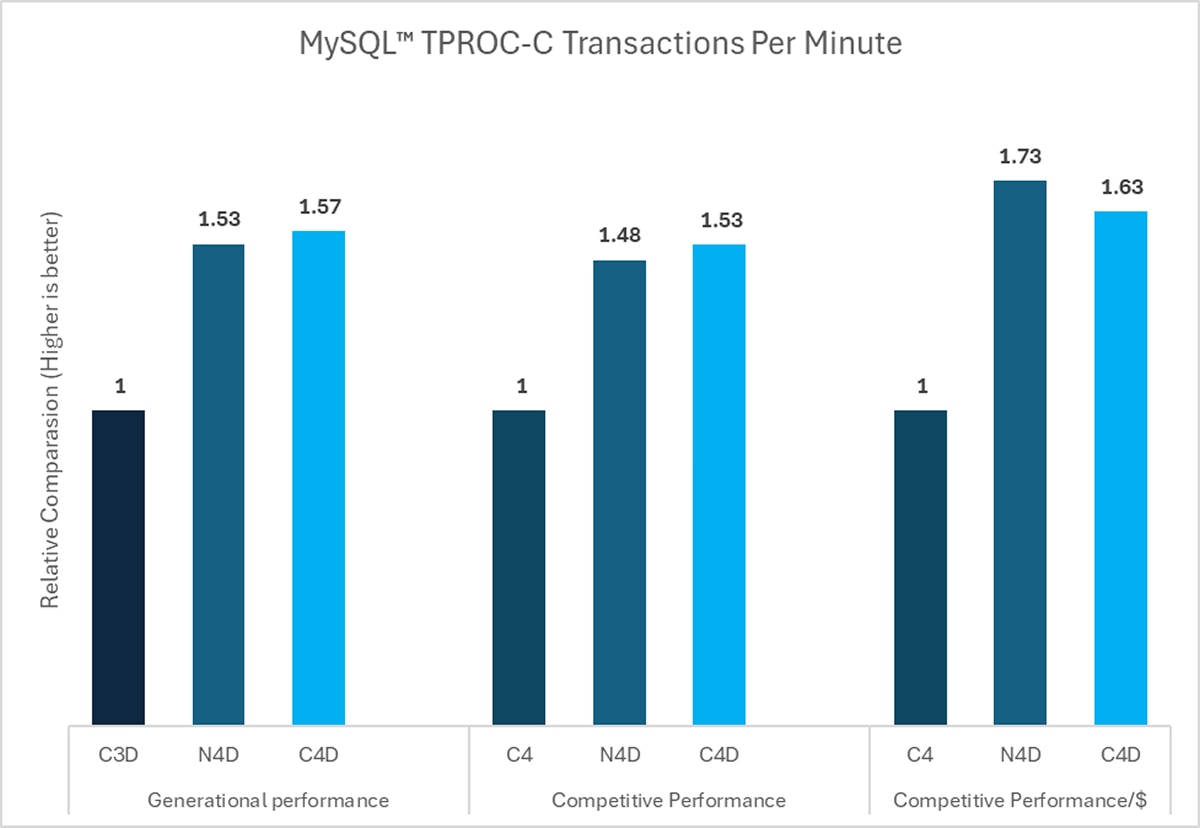
Figure 3: MySQL™ TPROC-C Transactions Per Minute7-10
4. Web Serving
NGINX™ is a widely used web server known for its flexibility and efficiency in handling client requests. It can function as a standalone server or enhance performance and security by acting as a reverse proxy, load balancer, mail proxy, or HTTP cache. To evaluate its performance, we used the popular WRK benchmarking tool, which generates substantial HTTP traffic to simulate real-world web serving conditions.
Figure 4 shows that C4D instances deliver approximately 1.83x and N4D instances deliver approximately 1.70x the NGINX throughput of C3D. C4D instances deliver approximately 1.75x and N4D instances deliver approximately 1.62x the NGINX throughput of C4. In terms of performance-per-dollar, C4D achieves around 1.87x and N4D achieves around 1.89x the efficiency of C4.
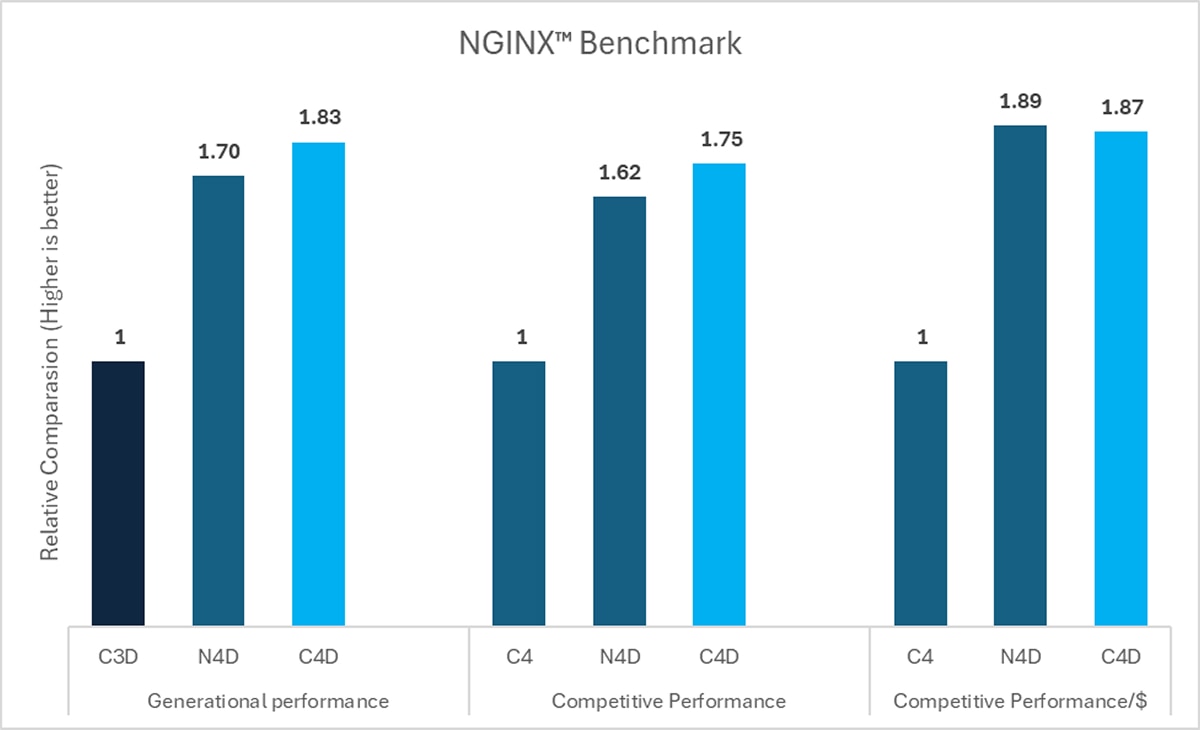
Figure 4: NGINX Benchmark using WRK7-10
5. In-Memory Analytics
Redis™ is a widely used in-memory data store that functions as a key-value database, cache, and message broker, with optional durability features. Its high performance and support for diverse data types—such as strings, lists, and maps — make it ideal for cloud-native environments and use cases like streaming, microservices, and real-time analytics.
To evaluate Redis performance, we used the redis-benchmark tool, which simulates multiple clients connecting to the server and measures the average number of requests handled per second. This provides a clear view of how well Redis performs under load. The results are an average of Get and Set.
Figure 5 shows that C4D instances deliver approximately 1.32x and N4D instances deliver approximately 1.82x the Redis throughput of C3D. C4D instances deliver approximately 1.63x and N4D instances deliver approximately 1.52x the Redis throughput of C4. In terms of performance-per-dollar, C4D achieves around 1.74x and N4D achieves around 1.77x the efficiency of C4.
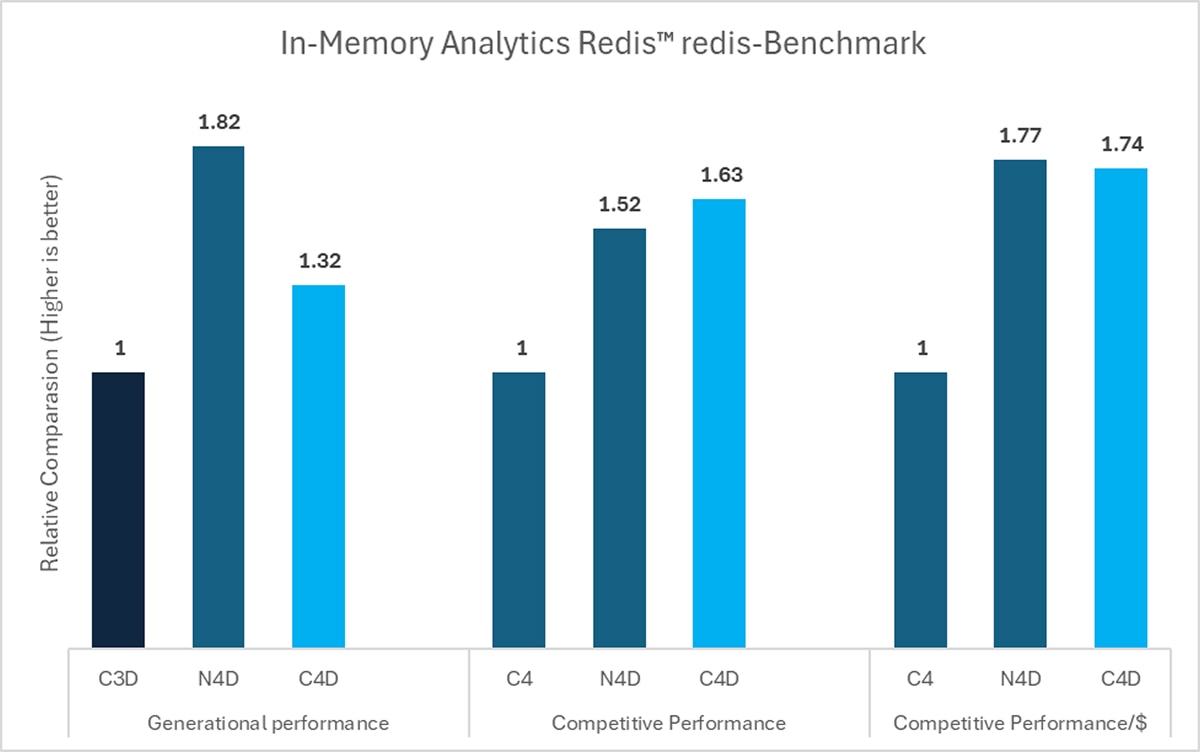
Figure 5: In-Memory Analytics Redis™ redis-Benchmark, Get and Set Average7-10
6. Media Processing
Media processing performance is critical for a wide range of workloads — from video encoding and transcoding to collaboration platforms and streaming services. FFmpeg is a powerful, open-source multimedia framework that includes a rich set of libraries, codecs, and tools for handling video, audio, and other media formats. Known for its command-line efficiency, FFmpeg is widely used for tasks such as encoding, transcoding, editing, scaling, post-production, and ensuring standards compliance.
For this evaluation, we averaged two encode and two transcode benchmarks using VP9 and h.264 codecs. These tests highlights C4D’s ability to manage high-resolution video content efficiently.
Figure 6 shows that C4D instances deliver approximately 1.47x and N4D deliver approximately 1.44x the FFmpeg throughput of C3D. C4D instances deliver approximately 1.70x and N4D delivers approximately 1.66x the FFmpeg throughput of C4. In terms of performance-per-dollar, C4D achieves around 1.81x and N4D achieves around 1.93x the efficiency of C4.
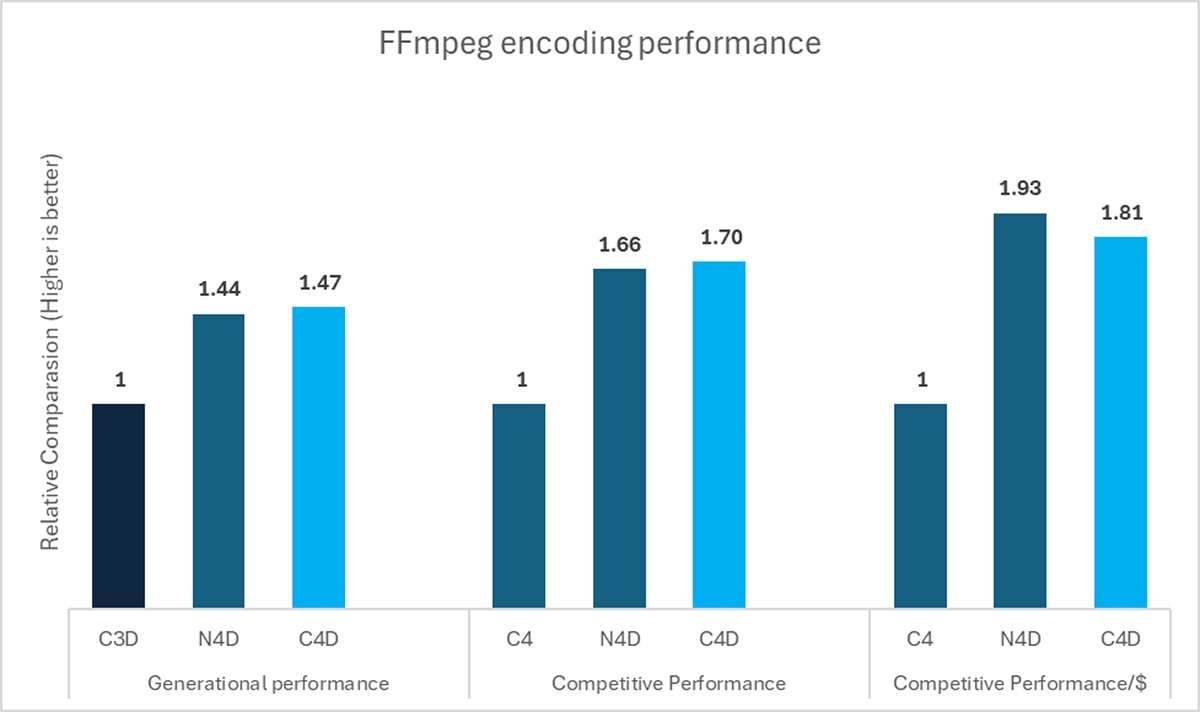
Figure 6: FFmpeg encode and transcode performance7-10
Conclusion:
In 2025, AMD and Google Cloud reached a new milestone in their collaboration with the launch of C4D and N4D virtual machines powered by 5th Gen AMD EPYC processors. These instances deliver significant generational improvements in performance, memory bandwidth, and security features. Benchmarking across a wide range of workloads—from enterprise applications and cloud-native services—shows that C4D and N4D consistently outperform the previous-generation C3D and offer strong competitive performance and price-performance against Intel-based C4 instances. With notable gains in throughput and performance-per-dollar across server-side Java, MySQL, NGINX, Redis, FFmpeg, C4D and N4D prove to be versatile and cost-effective solutions for modern computing needs. These VM launches underscore the continued innovation of AMD and its deep collaboration with Google Cloud to deliver scalable, energy-efficient infrastructure for today’s most demanding workloads.


Related Blogs
-
AMD-SUSE-EnterpriseAI
AMD, SUSE, and RGS are delivering a secure, open AI platform to accelerate private, sovereign, and enterprise AI deployments.
July 22, 2026
-
Scaling MiniMax-M3 Inference with Distributed Serving and Operator Co-Design on AMD Instinct MI355X GPUs — ROCm Blogs
Optimize MiniMax-M3 inference on AMD Instinct™ MI355X GPUs with ATOM online quantization, AITER sparse attention, FP8 KV cache, and EAGLE3.
July 20, 2026
-
Ideogram Scales Open Image Model with AMD Instinct™ GPU-Powered Inference
Ideogram 4.0 Releases Best Open Image Model AMD Instinct GPUs Power Production-scale Inference End-to-End Enterprise Capabilities Built to Scale
July 20, 2026
-
What to Expect at AMD Advancing AI 2026
Get a preview of AMD Advancing AI 2026, including key themes, sessions, and innovations shaping the future of AI. Discover how industry leaders are coming together to explore real-world use cases and strategies for scaling AI across the enterprise.
July 14, 2026
-
Triton-Based Optimization of Video Sparse Attention on ROCm — ROCm Blogs
Optimize video sparse attention on ROCm with GEAK and linear global context for faster, more stable video generation on AMD GPUs.
July 12, 2026
-
QuickReduce INT3 Quantization and Benchmarking on MI355 — ROCm Blogs
Learn how QuickReduce uses INT3 quantization to accelerate all-reduce communication and evaluate its performance and accuracy on AMD Instinct MI355 GPUs.
July 12, 2026
-
SGLang-ATOM: Bring ROCm-Native Acceleration to SGLang Serving — ROCm Blogs
Explore how SGLang-ATOM connects SGLang serving applications with ROCm-native ATOM execution to accelerate LLM inference on AMD Instinct GPUs.
July 07, 2026
-
Moving IT Forward: Managing the Server Memory Market Challenge of 2026
AMD experts share how right-sizing server memory with EPYC processors helps IT manage 2026 memory market cost and supply constraints.
July 06, 2026


Footnotes
Cloud performance results presented are based on the test date in the configuration. Results may vary due to changes to the underlying configuration, and other conditions such as the placement of the VM and its resources, optimizations by the cloud service provider, accessed cloud regions, co-tenants, and the types of other workloads exercised at the same time on the system.
1. EPYC-055A - Mercury Research Sell-In Revenue Shipment Estimates, Q2 2025. Revenue share of 41.0%, unit share of 27.3%.
2. 9xx5-001: Based on AMD internal testing as of 9/10/2024, geomean performance improvement (IPC) at fixed-frequency.
- 5th Gen EPYC CPU Enterprise and Cloud Server Workloads generational IPC Uplift of 1.170x (geomean) using a select set of 36 workloads and is the geomean of estimated scores for total and all subsets of SPECrate®2017_int_base (geomean), estimated scores for total and all subsets of SPECrate®2017_fp_base (geomean), scores for Server Side Java multi instance max ops/sec, representative Cloud Server workloads (geomean), and representative Enterprise server workloads (geomean). “Genoa” Config (all NPS1): EPYC 9654 BIOS TQZ1005D 12c12t (1c1t/CCD in 12+1), FF 3GHz, 12x DDR5-4800 (2Rx4 64GB), 32Gbps xGMI; “Turin” config (all NPS1): EPYC 9V45 BIOS RVOT1000F 12c12t (1c1t/CCD in 12+1), FF 3GHz, 12x DDR5-6000 (2Rx4 64GB), 32Gbps xGMI. Utilizing Performance Determinism and the Performance governor on Ubuntu® 22.04 w/ 6.8.0-40-generic kernel OS for all workloads.
- 5th Gen EPYC generational ML/HPC Server Workloads IPC Uplift of 1.369x (geomean) using a select set of 24 workloads and is the geomean of representative ML Server Workloads (geomean), and representative HPC Server Workloads (geomean). “Genoa Config (all NPS1) “Genoa” config: EPYC 9654 BIOS TQZ1005D 12c12t (1c1t/CCD in 12+1), FF 3GHz, 12x DDR5-4800 (2Rx4 64GB), 32Gbps xGMI; “Turin” config (all NPS1): EPYC 9V45 BIOS RVOT1000F 12c12t (1c1t/CCD in 12+1), FF 3GHz, 12x DDR5-6000 (2Rx4 64GB), 32Gbps xGMI. Utilizing Performance Determinism and the Performance governor on Ubuntu 22.04 w/ 6.8.0-40-generic kernel OS for all workloads except LAMMPS, HPCG, NAMD, OpenFOAM, Gromacs which utilize 24.04 w/ 6.8.0-40-generic kernel.
3. 9xx5C-066 Testing by AMD Performance Labs as of 11/26/2025. N4D-standard-16 score comparison to C3D-standard-16 estimated SPECrate®2017_int_base benchmark scores
Performance differences (normalized to C3D):
N4D 16 vCPU vs C3D 16 vCPU Perf (est) Perf/$ (est) OpEx Savings
SPECrate®2017 Integer 1.29 1.39 ~27.8%
On-demand hourly pricing from https://cloud.google.com/compute/vm-instance-pricing (us-central1) as of 12/08/2025: N4D: $0.678, C3D $0.726
SPEC®, SPECrate® and SPECint® are registered trademarks of Standard Performance Evaluation Corporation. Learn more at spec.org.
4. 9xx5C-067: Testing by AMD Performance Labs as of 11/26/2025. N4D-standard-16 score comparison to C4-standard-16 estimated SPECrate®2017_int_base benchmark scores
Performance differences (normalized to C4):
N4D 16 vCPU vs C4 16 vCPU Perf (est) Perf/$ (est) OpEx SavingsSPECrate®2017 Integer 1.23 1.43 ~30.2%
On-demand hourly pricing from https://cloud.google.com/compute/vm-instance-pricing (us-central1) as of 12/08/2025: N4D: $0.678, C4 $0.791
SPEC®, SPECrate® and SPECint® are registered trademarks of Standard Performance Evaluation Corporation. Learn more at spec.org.
5. 9xx5C-041: Testing by AMD Performance Labs as of 2/21/2025. C4D-standard-16 score comparison to C3D-standard-16 estimated SPECrate®2017_int_base benchmark scores
Performance differences (normalized to C3D):
C4D 16 vCPU vs C3D 16 vCPU Perf (est) Perf/$ (est) OpEx Savings
SPECrate®2017 Integer 1.27 1.24 ~19.6%
On-demand hourly pricing from https://cloud.google.com/compute/vm-instance-pricing (us-central1) as of 8/1/2025: C4D: $0.740, C3D $0.726
SPEC®, SPECrate® and SPECint® are registered trademarks of Standard Performance Evaluation Corporation. Learn more at spec.org.
6. 9xx5C-042: Testing by AMD Performance Labs as of 3/11/2025. C4D-standard-16 score comparison to C4-standard-16 estimated SPECrate®2017_int_base benchmark scores
Performance differences (normalized to C4):
C4D 16 vCPU vs C4 16 vCPU Perf (est) Perf/$ (est) OpEx Savings
SPECrate®2017 Integer 1.20 1.29 ~22.3%
On-demand hourly pricing from https://cloud.google.com/compute/vm-instance-pricing (us-central1) as of 8/1/2025: C4D: $0.740, C4 $0.791
SPEC®, SPECrate® and SPECint® are registered trademarks of Standard Performance Evaluation Corporation. Learn more at spec.org.
7. 9xx5C-068: Testing by AMD Performance Labs as of 11/26/2025. N4D-standard-16 score comparison to C3D-standard-16 running the following benchmarks:
- Server-side Java multi-instance max with Open JDK-21
- FFmpeg v6.1.1 (average of 2x encode and 2x transcode)
- Redis 7.2 (average of get and set)
- NGINX 1.1.9-2, WRK 4.2
- MySQL HammerDB TPROC-C 4.2
Performance differences (normalized to C3D):
N4D 16 vCPU vs C3D 16 vCPU Perf Perf/$ OpEx Savings
Server-side Java Multi-instance 1.18 1.27 21.0%
FFmpeg Average 1.44 1.54 35.2%
Redis Average 1.82 1.95 48.6%
NGINX 1.70 1.82 45.0%
MySQL TPROC-C 1.53 1.64 38.9%
Top 5 Workload Benchmarks 1.53 1.64 37.8%
On-demand hourly pricing from https://cloud.google.com/compute/vm-instance-pricing (us-central1) as of 12/08/2025: N4D: $0.678, C3D $0.726
OpEx savings calculated from relative runtime and instance cost ratio.
The HammerDB TPROC-C for MySQL workload is an open-source workload derived from TPC-Benchmark™ Standard, and as such is not comparable to published TPC-C™ results, as the results do not comply with the TPC-C Benchmark Standard.
Java is a registered trademark of Oracle and/or its affiliates.
8. 9xx5C-016: Testing by AMD Performance Labs as of 3/11/2025. C4D-standard-16 score comparison to C3D-standard-16 running the following benchmarks:
- Server-side Java multi-instance max with Open JDK-21
- FFmpeg v6.1.1 (average of 2x encode and 2x transcode)
- Redis 7.2 (average of get and set)
- NGINX 1.1.9-2, WRK 4.2
- MySQL HammerDB TPROC-C 4.2
Performance differences (normalized to C3D):
C4D 16 vCPU vs C3D 16 vCPU Perf Perf/$ OpEx Savings
Server-side Java Multi-instance Max Performance 1.24 1.22 17.9%
FFmpeg Average 1.47 1.45 30.8%
Redis Average 1.32 1.29 22.5%
NGINX 1.83 1.79 44.2%
MySQL TPROC-C 1.57 1.54 35.2%
Top 5 Workload Benchmarks 1.49 1.46 30.1%
On-demand hourly pricing from https://cloud.google.com/compute/vm-instance-pricing (us-central1) as of 8/1/2025: C4D: $0.740, C3D $0.726
OpEx savings calculated from relative runtime and instance cost ratio.
The HammerDB TPROC-C for MySQL workload is an open-source workload derived from TPC-Benchmark™ Standard, and as such is not comparable to published TPC-C™ results, as the results do not comply with the TPC-C Benchmark Standard.
Java is a registered trademark of Oracle and/or its affiliates.
9. 9xx5C-069: Testing by AMD Performance Labs as of 11/26/2025. N4D-standard-16 score comparison to C4-standard-16 running the following benchmarks:
- Server-side Java multi-instance max with Open JDK-21
- FFmpeg v6.1.1 (average of 2x encode and 2x transcode)
- Redis 7.2 (average of get and set)
- NGINX 1.1.9-2, WRK 4.2
- MySQL HammerDB TPROC-C 4.2
Performance differences (normalized to C4):
N4D 16 vCPU vs C4 16 vCPU Perf Perf/$ OpEx Savings
Server-side Java Multi-instance Max Performance 1.16 1.36 26.4%
FFmpeg Average 1.66 1.93 48.3%
Redis Average 1.52 1.77 43.6%
NGINX 1.62 1.89 47.2%
MySQL TPROC-C 1.48 1.73 42.3%
Top 5 Workload Benchmarks 1.49 1.74 41.5%
On-demand hourly pricing from https://cloud.google.com/compute/vm-instance-pricing (us-central1) as of 12/08/2025: N4D: $0.678, C4 $0.791
The HammerDB TPROC-C for MySQL workload is an open-source workload derived from TPC-Benchmark™ Standard, and as such is not comparable to published TPC-C™ results, as the results do not comply with the TPC-C Benchmark Standard.
Java is a registered trademark of Oracle and/or its affiliates.
10. 9xx5C-018: Testing by AMD Performance Labs as of 3/11/2025. C4D-standard-16 score comparison to C4-standard-16 running the following benchmarks:
- Server-side Java multi-instance max with Open JDK-21
- FFmpeg v6.1.1 (average of 2x encode and 2x transcode)
- Redis 7.2 (average of get and set)
- NGINX 1.1.9-2, WRK 4.2
- MySQL HammerDB TPROC-C 4.2
Performance differences (normalized to C4):
C4D 16 vCPU vs C4 16 vCPU Perf Perf/$ Relative Runtime OpEx Savings
Server-side Java Multi-instance Max Performance 1.22 1.31 82% 23.4%
FFmpeg Average 1.70 1.81 59% 44.8%
Redis Average 1.63 1.74 62% 42.4%
NGINX 1.75 1.87 57% 46.4%
MySQL TPROC-C 1.53 1.63 65% 38.8%
Top 5 Workload Benchmarks 1.56 1.67 39.2%
On-demand hourly pricing from https://cloud.google.com/compute/vm-instance-pricing (us-central1) as of 8/1/2025: C4D: $0.740, C4 $0.791
OpEx savings calculated from relative runtime and instance cost ratio.
The HammerDB TPROC-C for MySQL workload is an open-source workload derived from TPC-Benchmark™ Standard, and as such is not comparable to published TPC-C™ results, as the results do not comply with the TPC-C Benchmark Standard.
Java is a registered trademark of Oracle and/or its affiliates.
TPROC-C is derived from industry-standard TPC-C™ and as such is not comparable to published TPC-C results, as the results do not comply with the TPC-C Benchmark Standard.
11. TPC benchmark used in testing is derived from the (TPC benchmark) benchmark and as such is not comparable to published (TPC benchmark) results, as the test results do not comply with the (TPC benchmark) Specification.