ChipScope Features & Capabilities
Many hardware issues only become apparent when the full, integrated system is running in real-time. Vivado ChipScope provides a comprehensive flow to maximize visibility into programmable logic for design debug during system operation.
Design Visibility
Scale to hundreds of internal nodes for a clear view of the inner workings of your design.
In-Depth Analysis
Implement complex trigger conditions and analyze across multiple views of the design.
Fast Debug Turns
Leverage incremental compile flows for fast iteration and Python™ to automate tasks.
AMD Vivado™ ChipScope Analyzer
This video provides a practical overview of how to implement and use ChipScope for hardware debugging. It covers the process of integrating internal logic analyzer and debug cores into programmable logic, setting up triggers, and analyzing captured data to identify and resolve issues quickly.

Step-by-Step Hardware Debug with Adam Taylor
Learn how to debug hardware in real systems using Vivado ChipScope in two distinct tutorials for AMD Versal™ and UltraScale+™ devices, authored by Adam Taylor. Each walkthrough emphasizes debug methodology, shows how to instrument designs effectively, and includes downloadable projects you can run and explore.
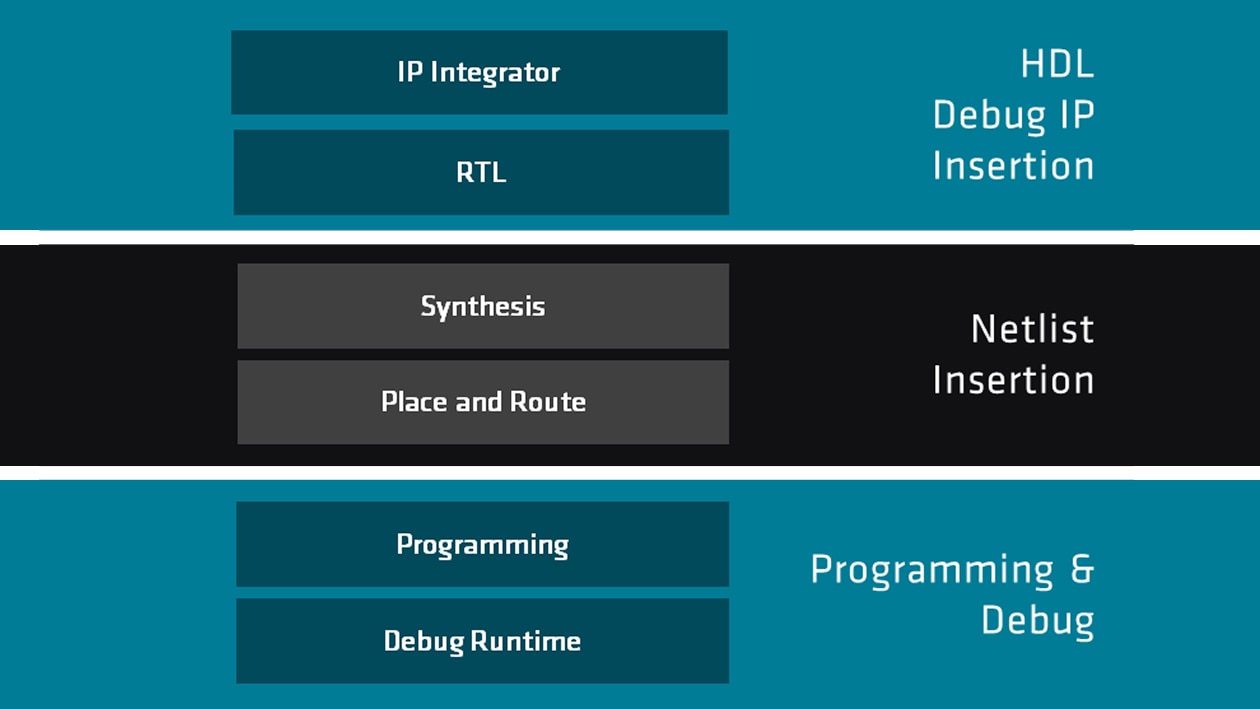
Comprehensive Debug Flow
Flexible methodologies for debug IP instrumentation, design analysis, runtime configuration, and incremental compile for fast debug turns.
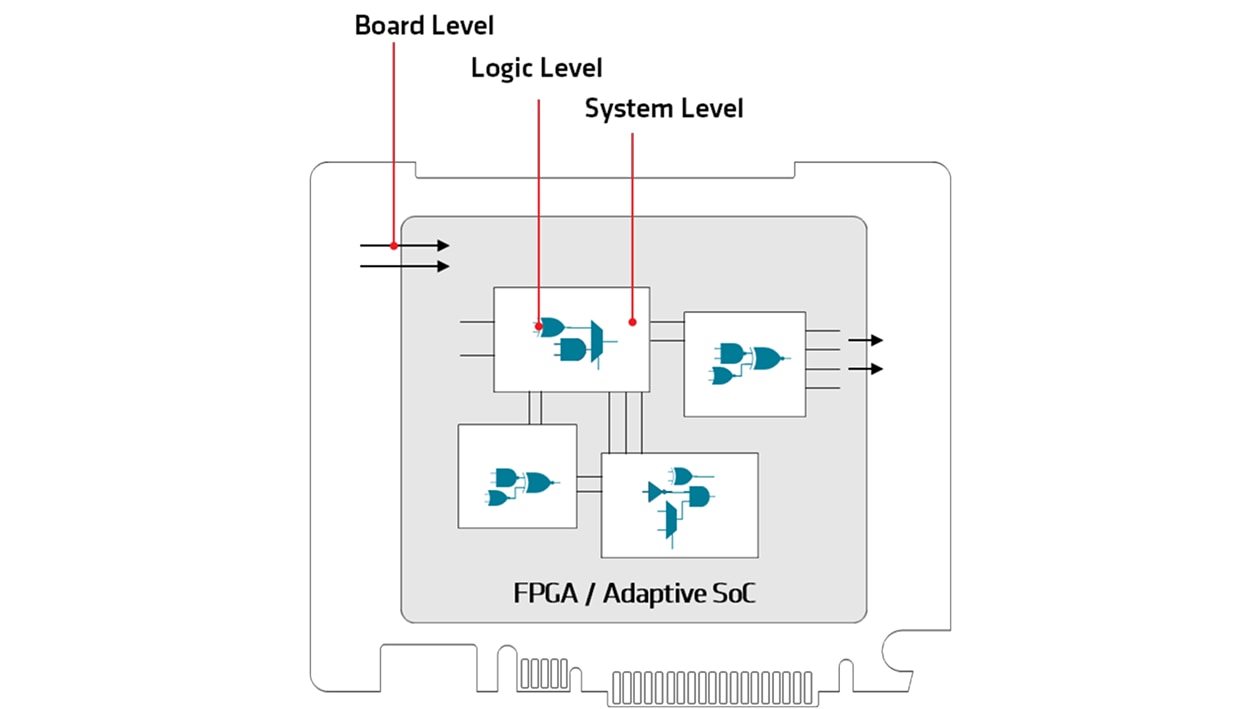
System Visibility
ChipScope provides multiple levels of abstraction for analyzing your system with a comprehensive set of IP to maximize visibility.
- Logic-Level Debug: Integrated Logic Analyzer (ILA) cores provide advanced trigger of internal signals and capture features to troubleshoot bugs in real time.
- System-Level Debug: Support for AXI interfaces and I/O protocols, enabling inspection at the transaction level across design blocks.
- Board-Level Debug: Explore board-level interaction with virtual I/O (VIO) cores, enabling signal monitoring and injecting test values to examine design behavior.
Image Zoom
Debug IP
Essential to the fabric debug flow is a set of IP cores to enable design visibility without obstructing design functionality. All AMD debug IP is available online as well as via the IP catalog within the Vivado Design Suite. Note that programmable logic debug for Versal™ adaptive SoCs is strictly AXI-based.
FPGAs & Zynq™ Adaptive SoCs |
AMD Versal Adaptive SoCs |
|
Integrated Logic Analyzer (ILA) |
||
System ILA |
||
Virtual Input / Output VIO |
||
BSCAN-to-JTAG Converter |
- |
|
Debug Hub* |
System Debug Bus (XSDB) – Built in |
*Debug Hub facilitates communication with debug IP cores over JTAG
Data Cable Modules
AMD offers a range of data cables for either standard JTAG debugging and high-speed debug of heterogeneous systems. Whether your priority is capturing large volumes of data, minimizing device resource utilization, or achieving faster debug performance, choosing the right data cable can impact the efficiency of your workflow.
In addition to data cable modules, most evaluation kits offer built-in USB-to-JTAG debug interfaces and select device families offer debug over Ethernet or PCI-Express®. Learn more about data cable modules below.
| Device Support | Platform Cable USB II | SmartLynq | SmartLynq+ |
|---|---|---|---|
| AMD FPGAs | ✓ | ✓ | |
| Zynq Adaptive SoCs | ✓ | ✓ | |
| Versal Adaptive SoCs | ✓ | ✓ |
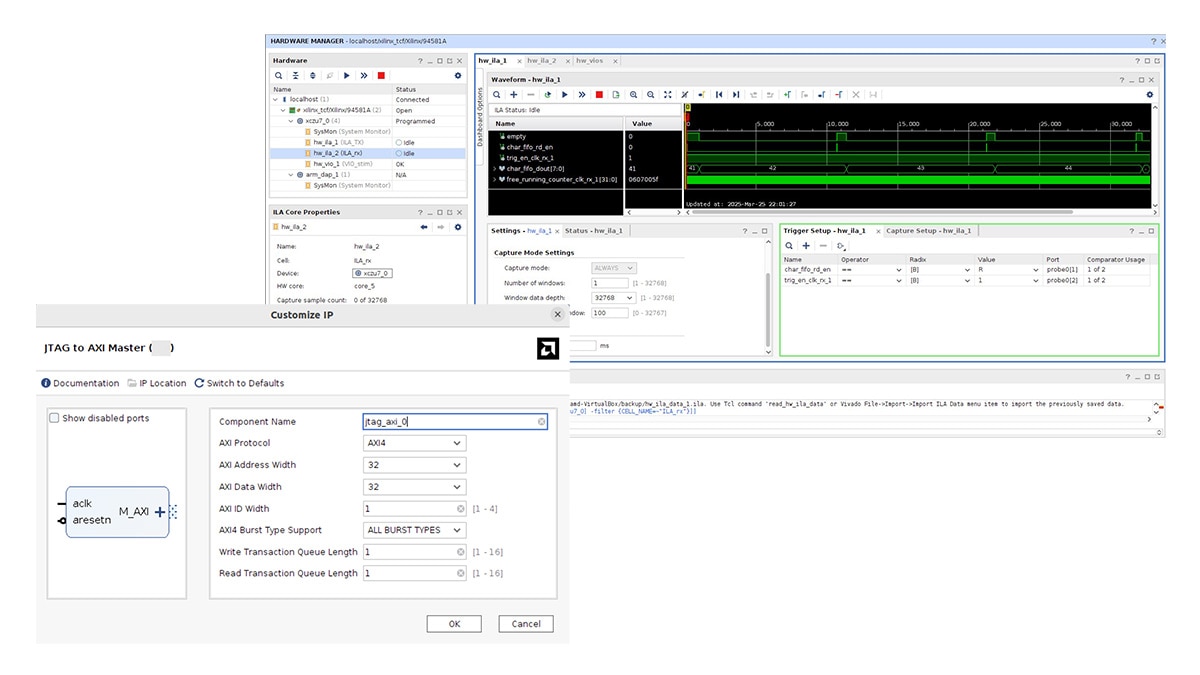
Design Analysis
ChipScope provides various interfaces and automation methods for in-system debug and trace. Within the Vivado IDE, designers can seamlessly navigate between high-level waveforms and design elements, as well as automate interaction through TCL or Python.
- Complex Triggering: Set multi-level triggers with state-based dependencies to reproduce complex design scenarios.
- Cross-Probing: Ability to cross-probe from debug output to RTL or netlist to analyze and identify root case of design bugs.
- Waveform Analysis: Displays captured signal transitions, annotating trigger information with ability to trace back to design source.
- Protocol Debug: Protocol-specific analysis with transaction timelines to identify bottlenecks and cross-probe from protocol events to RTL.
- VIO Interface: Drive signals for interactive test and monitoring without stopping or reprogramming the design.
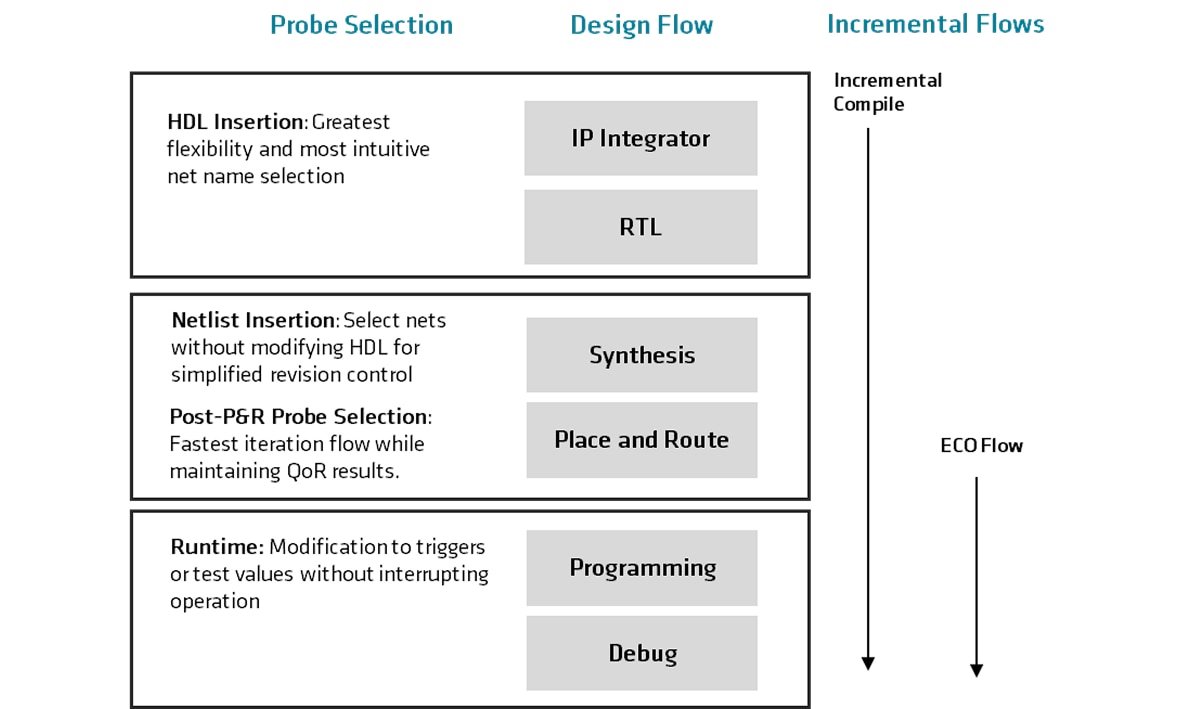
Fast Debug Turns
Incremental Flows
Modification of trigger, probes, and debug cores is inevitable as bugs are being uncovered, making rapid iteration critical. ChipScope leverages multiple types of incremental compile flows to modify only changed portions of the design, avoiding a full rebuild during debug cycles.
Multiple incremental flows are available depending on debug instrumentation method:
- Incremental Compile: Performs synthesis and P&R on changed portions of the design
- ECO Flow: For post-place-and-route probe selection – ideal for minor changes and the fastest way to iterate with maximum design preservation
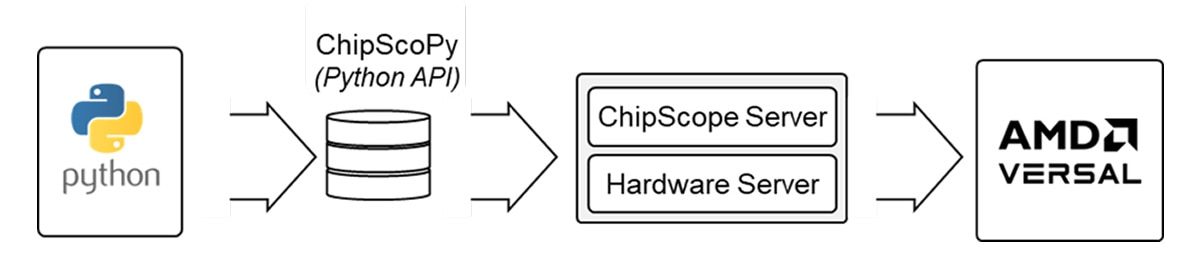
ChipScoPy: Python API for Automation
For Versal devices, ChipScoPy is a simple Python interface for automating ChipScope capabilities without the need for the Vivado IDE, enabling greater debug automation and control for programmable logic and various hard IP.
Advantages include:
- Flexible and user-customizable flow that can be fully scripted
- Extensible flow that can use 3rd party and open-source packages such as plot viewer
- Smaller install footprint since Vivado tool install is not required